<?xml version="1.0" encoding="utf-8"?><feed xmlns="http://www.w3.org/2005/Atom" xml:lang="en"><generator uri="https://jekyllrb.com/" version="4.4.1">Jekyll</generator><link href="https://kc-explore.github.io/feed.xml" rel="self" type="application/atom+xml" /><link href="https://kc-explore.github.io/" rel="alternate" type="text/html" hreflang="en" /><updated>2026-06-29T21:21:50+00:00</updated><id>https://kc-explore.github.io/feed.xml</id><title type="html">MrK — Field Notes</title><subtitle>A personal blog by MrK — a cybersecurity engineer writing about self-hosted AI, homelabs, automation, and hardening systems from the hypervisor up. No hype, no affiliate links. Just field notes from the build.</subtitle><author><name>MrK</name></author><entry><title type="html">The npm Worm in Your Homelab: Surviving Supply-Chain Attacks</title><link href="https://kc-explore.github.io/npm-supply-chain-homelab/" rel="alternate" type="text/html" title="The npm Worm in Your Homelab: Surviving Supply-Chain Attacks" /><published>2026-06-15T00:00:00+00:00</published><updated>2026-06-15T00:00:00+00:00</updated><id>https://kc-explore.github.io/npm-supply-chain-homelab</id><content type="html" xml:base="https://kc-explore.github.io/npm-supply-chain-homelab/"><![CDATA[<p>You didn’t write the vulnerable code. You didn’t pick a sketchy package from a dark corner of the registry. You ran <code class="language-plaintext highlighter-rouge">npm install</code> on a dependency you’ve used for years, trusted by millions, authored by someone with a solid reputation — and somewhere three or four hops down the dependency tree, a maintainer whose name you’ve never heard got phished, and now a cryptominer is running on your machine.</p>

<p>This is the uncomfortable shape of supply-chain attacks: you don’t have to be targeted. You just have to install something that depends on something that depends on something that got compromised. The attack doesn’t need to find you. It’s already inside the thing you trust.</p>

<p>For a homelab running Node.js services, this isn’t a corporate threat-model problem. It’s a you problem. Your machine has npm tokens, environment files, cloud credentials, maybe SSH keys sitting in <code class="language-plaintext highlighter-rouge">~/.ssh</code>. You run things as your own user. If a postinstall script gets code execution on your box, it has what it needs. The attack surface is the whole machine, not just the package.</p>

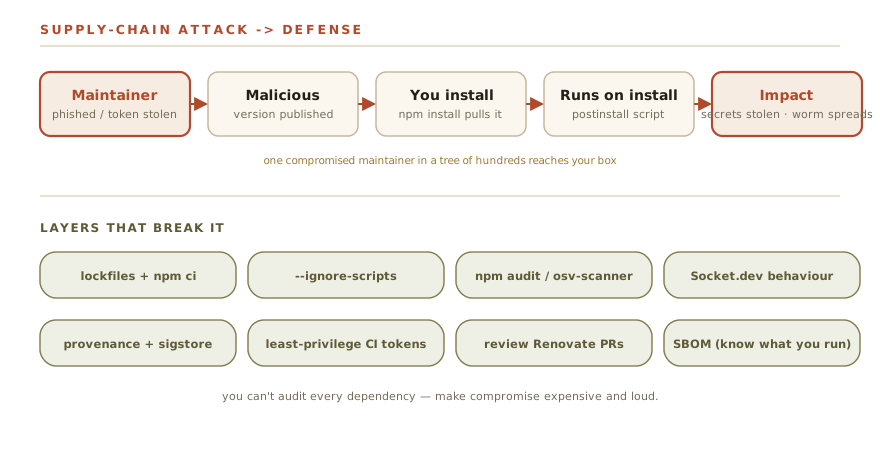
<figure class="diagram">
  <img src="/assets/diagrams/npm-supply-chain/supply-chain.svg" alt="A software supply-chain attack path — attacker compromises a maintainer, publishes a malicious package version, which runs on install and exfiltrates secrets or self-propagates — set against the layered defenses that break each stage." />
  <figcaption>How a supply-chain compromise reaches your machine — and the layers that break the chain.</figcaption>
</figure>

<hr />

<h2 id="how-these-attacks-actually-work">How These Attacks Actually Work</h2>

<p>Before the case files, it’s worth having a clear taxonomy. These attacks aren’t all the same. The delivery mechanism matters, because it determines which defenses actually help.</p>

<table>
  <thead>
    <tr>
      <th>Attack pattern</th>
      <th>How it gets in</th>
      <th>Real example</th>
    </tr>
  </thead>
  <tbody>
    <tr>
      <td><strong>Maintainer account takeover</strong></td>
      <td>Attacker phishes or credential-stuffs an npm account, publishes malicious version</td>
      <td>ua-parser-js (2021), chalk/debug/qix (2025)</td>
    </tr>
    <tr>
      <td><strong>Malicious maintainer handoff</strong></td>
      <td>Original author transfers package ownership to attacker posing as a contributor</td>
      <td>event-stream (2018)</td>
    </tr>
    <tr>
      <td><strong>Hostile maintainer</strong></td>
      <td>Legitimate, trusted maintainer deliberately introduces a destructive payload</td>
      <td>node-ipc (2022)</td>
    </tr>
    <tr>
      <td><strong>Typosquatting</strong></td>
      <td>Attacker registers a package with a name close to a popular one, waits for typos</td>
      <td>Ongoing, hundreds of examples</td>
    </tr>
    <tr>
      <td><strong>Dependency confusion</strong></td>
      <td>Attacker publishes a package on public npm that shares a name with your private internal package</td>
      <td>Reported widely since 2021</td>
    </tr>
    <tr>
      <td><strong>Malicious lifecycle scripts</strong></td>
      <td>Any of the above use <code class="language-plaintext highlighter-rouge">postinstall</code>, <code class="language-plaintext highlighter-rouge">preinstall</code>, or <code class="language-plaintext highlighter-rouge">install</code> hooks to get code execution at install time</td>
      <td>Used in ua-parser-js, Shai-Hulud</td>
    </tr>
  </tbody>
</table>

<p>The last row is what makes npm attacks particularly effective: installing a package isn’t a passive act. npm runs scripts. By default, any package in your tree can execute arbitrary code the moment you run <code class="language-plaintext highlighter-rouge">npm install</code>. You gave it permission when you hit Enter.</p>

<hr />

<h2 id="the-case-files">The Case Files</h2>

<h3 id="event-stream--2018--the-maintainer-handoff">event-stream — 2018 — The Maintainer Handoff</h3>

<p>The original, and still the most elegantly patient attack in npm history.</p>

<p>The <code class="language-plaintext highlighter-rouge">event-stream</code> package was a widely-used Node.js streaming utility with tens of millions of downloads. Its original author, Dominic Tarr, had largely moved on from maintaining it. In September 2018 he transferred ownership to a new contributor called <code class="language-plaintext highlighter-rouge">right9ctrl</code>, who seemed interested in helping out.</p>

<p>Two months later, <code class="language-plaintext highlighter-rouge">right9ctrl</code> released version 3.3.6. It added a new dependency: <code class="language-plaintext highlighter-rouge">flatmap-stream</code>. Buried inside <code class="language-plaintext highlighter-rouge">flatmap-stream</code> was an AES-256 encrypted payload that only executed if a very specific condition was met — the <code class="language-plaintext highlighter-rouge">npm_package_description</code> environment variable had to equal the string <code class="language-plaintext highlighter-rouge">"A Secure Bitcoin Wallet"</code>. That’s the description field of a specific application: Copay, a Bitcoin wallet used by large holders.</p>

<p>The attack was inert for everyone except Copay users running versions 5.0.2 through 5.1.0. For them, it silently exfiltrated wallet credentials and private keys to a server in Kuala Lumpur. It sat undetected for about two months and amassed roughly 8 million downloads before a developer noticed the suspicious dependency.</p>

<p><strong>The lesson:</strong> Targeted attacks can hide in plain sight. Your packages don’t have to target you specifically for you to be collateral damage. And “passing the maintenance baton” is a known attack surface — right9ctrl had literally asked for maintainer access.</p>

<hr />

<h3 id="ua-parser-js--october-2021--account-takeover">ua-parser-js — October 2021 — Account Takeover</h3>

<p><code class="language-plaintext highlighter-rouge">ua-parser-js</code> detects browser, OS, and device type from User-Agent strings. Nearly 8 million weekly downloads. Used in production at Facebook, Microsoft, Amazon, Slack, Discord, and a few hundred other organizations you’ve heard of.</p>

<p>On October 22, 2021, someone compromised the maintainer’s npm account and published three malicious versions: 0.7.29, 0.8.0, and 1.0.0. Each shipped an install-time script (a <code class="language-plaintext highlighter-rouge">preinstall</code> hook) that, depending on the operating system, either downloaded an XMRig Monero cryptominer (Linux) or deployed a Windows cryptominer plus an infostealer that harvested credentials from the machine — then sent the haul home.</p>

<p>The malicious versions were live for roughly four hours. Clean versions (0.7.30, 0.8.1, 1.0.1) were published shortly after. Four hours was enough.</p>

<p><strong>The lesson:</strong> Account takeover can happen to careful, legitimate maintainers. You have no visibility into the security posture of every account in your dependency tree. A lockfile pins the version but doesn’t protect you if the attack already exists in the pinned version — which is exactly why keeping lockfiles committed and auditing them matters.</p>

<hr />

<h3 id="node-ipc--march-2022--hostile-maintainer">node-ipc — March 2022 — Hostile Maintainer</h3>

<p>This one is different, and in some ways more disturbing, because the attack came from the legitimate maintainer acting deliberately.</p>

<p>Brandon Nozaki Miller, who maintained the popular <code class="language-plaintext highlighter-rouge">node-ipc</code> inter-process communication package, pushed malicious code in node-ipc versions 10.1.1 and 10.1.2. The payload checked whether the machine’s IP geolocated to Russia or Belarus. If so, it recursively overwrote files with a heart emoji — effectively destroying data on those machines as a protest against the Russian invasion of Ukraine. (A separate, milder module the same author added around the same time, <code class="language-plaintext highlighter-rouge">peacenotwar</code>, merely dropped a protest text file; the destructive overwrite was node-ipc’s own code.)</p>

<p>Vue CLI, one of the most widely used JavaScript scaffolding tools, depended on node-ipc. The protestware shipped to users who ran Vue CLI setup scripts during that window.</p>

<p>The technical mechanism — a trusted maintainer pushing a destructive payload — is identical to a supply-chain attack. That the motivation was political rather than financial changes nothing from a systems security perspective. Code you didn’t write and can’t audit executed on your machine and destroyed data.</p>

<p>CVE-2022-23812 was assigned. The malicious versions were pulled.</p>

<p><strong>The lesson:</strong> Behavioral auditing of packages matters, not just version pinning. A package that was safe last week can become dangerous this week because of a human decision, not a hack. This is the argument for tools that flag behavioral changes in packages — new network calls, new file operations, new lifecycle scripts — between versions.</p>

<hr />

<h3 id="september-2025--the-qix-compromise-chalk-debug-and-16-others">September 2025 — The qix Compromise (chalk, debug, and 16 others)</h3>

<p>On September 8, 2025, malicious versions of 18 npm packages started appearing on the registry. The packages included <code class="language-plaintext highlighter-rouge">chalk</code> (around 300 million weekly downloads), <code class="language-plaintext highlighter-rouge">debug</code> (even higher), <code class="language-plaintext highlighter-rouge">color-convert</code>, <code class="language-plaintext highlighter-rouge">color-name</code>, <code class="language-plaintext highlighter-rouge">ansi-styles</code>, <code class="language-plaintext highlighter-rouge">strip-ansi</code>, and a dozen others — collectively over two billion weekly downloads.</p>

<p>The attack vector was a phishing campaign targeting npm maintainers. The domain <code class="language-plaintext highlighter-rouge">npmjs.help</code> was used to harvest credentials through a convincing fake “two-factor authentication update” email. The account compromised belonged to <code class="language-plaintext highlighter-rouge">qix</code>, a prolific maintainer who controlled a substantial slice of the color and terminal utility ecosystem — packages that show up in virtually every Node.js project’s transitive dependencies.</p>

<p>The malicious payload hooked into <code class="language-plaintext highlighter-rouge">fetch</code>, <code class="language-plaintext highlighter-rouge">XMLHttpRequest</code>, and browser wallet APIs (<code class="language-plaintext highlighter-rouge">window.ethereum</code>, Solana endpoints) to intercept and reroute cryptocurrency transactions to attacker-controlled addresses. A classic browser crypto-clipper — but delivered via packages that run in Node.js build pipelines, which also get bundled into browser-facing code.</p>

<p>Aikido Security detected the malicious versions approximately two hours after they appeared. During that two-hour window, the malicious code reached an estimated one in ten cloud environments.</p>

<p><strong>The lesson:</strong> Ubiquitous utility packages — the ones every project pulls in — are the highest-value targets precisely because they’re everywhere. A two-hour exposure window on a package with hundreds of millions of weekly downloads is a very bad two hours.</p>

<hr />

<h3 id="shai-hulud--septembernovember-2025--the-worm">Shai-Hulud — September–November 2025 — The Worm</h3>

<p>This is the one that represents a genuine evolution, and if you run a homelab with any npm activity, it’s worth understanding in detail.</p>

<p>Shai-Hulud (named after the sandworm from Dune, because threat researchers have taste) was first detected by ReversingLabs on September 15, 2025, with the initial infection beginning September 14. What made it different from every previous npm attack is what it did after it ran on your machine.</p>

<p>Most supply-chain attacks are one-directional: compromise a package, get code execution on victim machines, exfiltrate credentials. Done.</p>

<p>Shai-Hulud added a second stage: it used the credentials it stole to <em>spread</em>.</p>

<p>The worm’s lifecycle:</p>
<ol>
  <li>Victim runs <code class="language-plaintext highlighter-rouge">npm install</code> on a poisoned package</li>
  <li>Postinstall script runs, downloads and executes <a href="https://github.com/trufflesecurity/trufflehog">TruffleHog</a> — the open-source secret scanner — against the victim’s local filesystem and environment</li>
  <li>TruffleHog finds npm tokens, GitHub tokens, AWS credentials, GCP credentials — whatever is present</li>
  <li>Credentials are exfiltrated to attacker-controlled webhooks</li>
  <li>If a valid npm publish token is found: the worm publishes malicious versions of every other package the victim maintains</li>
  <li>Each newly-infected package repeats from step 1 when anyone installs it</li>
</ol>

<p>Over 180 packages were compromised in the initial wave. A second variant (“Shai-Hulud 2.0”) arrived in November 2025 with improved evasion techniques and compromised over 500 packages. A further campaign dubbed “Mini Shai-Hulud” surfaced in spring 2026, hitting packages across the TanStack, Mistral AI, and other dependency trees.</p>

<p>The self-replication is what makes this qualitatively different. Previous attacks required the attacker to maintain access to a specific compromised account. Shai-Hulud spread the infection autonomously using its victims as propagation infrastructure.</p>

<p><strong>The lesson for a homelabber:</strong> If you maintain <em>any</em> npm packages — even tiny personal ones — your npm publish token sitting in <code class="language-plaintext highlighter-rouge">~/.npmrc</code> is a worm propagation vector. Your machine is a potential node in someone else’s botnet. Least-privilege tokens with minimal scope and short TTLs aren’t paranoia; they’re hygiene.</p>

<hr />

<div class="callout">
  <p><strong>The uncomfortable math.</strong></p>

  <p>Pick any reasonably complex Node.js project. Run <code class="language-plaintext highlighter-rouge">npm ls --all</code> and count the unique packages. A typical Express app has 300-500 transitive dependencies. Each dependency is maintained by at least one person. Each of those people has an npm account. Each of those accounts is one convincing phishing email away from being compromised.</p>

  <p>You have almost certainly never heard of the majority of maintainers in your dependency tree. You have no insight into whether they use a password manager, whether they have MFA enabled, or whether they’re under financial pressure that might make a malicious handoff attractive.</p>

  <p>The September 2025 attack moved from phishing email to malicious version live on npm to “in one in ten cloud environments” in two hours. That is not a timeline that allows for manual human response.</p>

  <p>Your transitive dependency graph is a trust surface you did not choose and cannot fully audit. The defenses below are about making compromise expensive and loud, not about making it impossible.</p>
</div>

<hr />

<h2 id="the-defense-stack">The Defense Stack</h2>

<p>These aren’t in alphabetical order. They’re in rough priority order for a homelab that runs Node.js services. Do the cheap ones first.</p>

<h3 id="1-commit-your-lockfile-always-use-npm-ci">1. Commit your lockfile. Always use <code class="language-plaintext highlighter-rouge">npm ci</code>.</h3>

<p>If you take nothing else from this post, take this.</p>

<p><code class="language-plaintext highlighter-rouge">npm install</code> resolves versions at install time and can silently pull in newer versions of packages. <code class="language-plaintext highlighter-rouge">npm ci</code> installs exactly what is in your lockfile and fails if there’s a mismatch. It is strictly safer for anything that isn’t an initial dependency resolution.</p>

<div class="language-bash highlighter-rouge"><div class="highlight"><pre class="highlight"><code><span class="c"># In any CI/CD pipeline or automated deploy:</span>
npm ci

<span class="c"># Not this:</span>
npm <span class="nb">install</span>
</code></pre></div></div>

<p>Your <code class="language-plaintext highlighter-rouge">package-lock.json</code> (or <code class="language-plaintext highlighter-rouge">yarn.lock</code>, or <code class="language-plaintext highlighter-rouge">pnpm-lock.yaml</code>) must be committed to your repository. A lockfile that isn’t committed isn’t protecting anything. It only pins versions if it’s there.</p>

<p>This doesn’t prevent an attack that’s already in the version you’ve locked to — but it prevents you from silently pulling in a compromised newer version because someone ran <code class="language-plaintext highlighter-rouge">npm install</code> and auto-updated.</p>

<h3 id="2-disable-lifecycle-scripts-for-ci-installs">2. Disable lifecycle scripts for CI installs</h3>

<p>npm runs <code class="language-plaintext highlighter-rouge">preinstall</code>, <code class="language-plaintext highlighter-rouge">install</code>, and <code class="language-plaintext highlighter-rouge">postinstall</code> scripts by default. These are how most supply-chain attacks get code execution. You can disable them:</p>

<div class="language-bash highlighter-rouge"><div class="highlight"><pre class="highlight"><code><span class="c"># One-time config:</span>
npm config <span class="nb">set </span>ignore-scripts <span class="nb">true</span>

<span class="c"># Or per-command:</span>
npm ci <span class="nt">--ignore-scripts</span>
</code></pre></div></div>

<p>The cost: some legitimate packages use postinstall scripts for binary compilation (native addons, things like <code class="language-plaintext highlighter-rouge">esbuild</code>, <code class="language-plaintext highlighter-rouge">sharp</code>, <code class="language-plaintext highlighter-rouge">node-sass</code>). With scripts disabled, those packages won’t work until you run their scripts manually. This is annoying; it is also a meaningful security improvement. You can selectively re-enable for specific packages:</p>

<div class="language-bash highlighter-rouge"><div class="highlight"><pre class="highlight"><code><span class="c"># After confirming the package is legit:</span>
npm rebuild esbuild
</code></pre></div></div>

<p>For a homelab CI pipeline that just runs your services, the odds are good that <code class="language-plaintext highlighter-rouge">--ignore-scripts</code> works without any extra steps. Try it.</p>

<h3 id="3-run-npm-audit--but-understand-its-limits">3. Run <code class="language-plaintext highlighter-rouge">npm audit</code> — but understand its limits</h3>

<div class="language-bash highlighter-rouge"><div class="highlight"><pre class="highlight"><code>npm audit
npm audit <span class="nt">--audit-level</span><span class="o">=</span>high
</code></pre></div></div>

<p><code class="language-plaintext highlighter-rouge">npm audit</code> checks your dependency tree against the npm advisory database for known vulnerabilities. It’s free, it’s built in, and you should be running it. The limit is that it only catches what’s been reported. Shai-Hulud packages were live for days or weeks before they were in any advisory database.</p>

<p>For broader coverage, Google’s <a href="https://google.github.io/osv-scanner/">OSV-Scanner</a> checks against multiple vulnerability databases simultaneously:</p>

<div class="language-bash highlighter-rouge"><div class="highlight"><pre class="highlight"><code><span class="c"># Install (it's a Go binary — Homebrew, Go, or a release binary):</span>
brew <span class="nb">install </span>osv-scanner
<span class="c"># or: go install github.com/google/osv-scanner/v2/cmd/osv-scanner@latest</span>

<span class="c"># Scan a project directory (or point at a lockfile):</span>
osv-scanner scan <span class="nb">source</span> <span class="nb">.</span>
osv-scanner <span class="nt">--lockfile</span> package-lock.json
</code></pre></div></div>

<p>Run both in your pipeline.</p>

<h3 id="4-use-socketdev-for-behavioral-analysis">4. Use Socket.dev for behavioral analysis</h3>

<p><a href="https://socket.dev">Socket.dev</a> is the most useful tool in this space that most people haven’t heard of. Where <code class="language-plaintext highlighter-rouge">npm audit</code> checks against known CVEs, Socket analyzes package behavior — does this new version make network calls it didn’t make before? Does it access the filesystem in new ways? Does it have a new postinstall script?</p>

<p>This is exactly the kind of signal that would have flagged event-stream and ua-parser-js earlier. The free tier covers open-source projects; there’s a GitHub integration and a CLI:</p>

<div class="language-bash highlighter-rouge"><div class="highlight"><pre class="highlight"><code>npx socket scan <span class="nb">.</span>
</code></pre></div></div>

<p>For a homelab context: I run this before pulling in any new dependency, not as part of automated CI. The noise-to-signal ratio is better when it’s a human check on a specific decision rather than a gate that blocks every install.</p>

<h3 id="5-pin-critical-dependencies-and-review-diffs-before-updating">5. Pin critical dependencies and review diffs before updating</h3>

<p>Dependabot and Renovate will auto-create PRs when your dependencies have updates. This is good. Auto-merging those PRs without review is not.</p>

<div class="language-yaml highlighter-rouge"><div class="highlight"><pre class="highlight"><code><span class="c1"># .github/dependabot.yml — reasonable config</span>
<span class="na">version</span><span class="pi">:</span> <span class="m">2</span>
<span class="na">updates</span><span class="pi">:</span>
  <span class="pi">-</span> <span class="na">package-ecosystem</span><span class="pi">:</span> <span class="s2">"</span><span class="s">npm"</span>
    <span class="na">directory</span><span class="pi">:</span> <span class="s2">"</span><span class="s">/"</span>
    <span class="na">schedule</span><span class="pi">:</span>
      <span class="na">interval</span><span class="pi">:</span> <span class="s2">"</span><span class="s">weekly"</span>
    <span class="c1"># Don't auto-merge major version bumps</span>
    <span class="na">open-pull-requests-limit</span><span class="pi">:</span> <span class="m">10</span>
</code></pre></div></div>

<p>When a PR comes in from Dependabot: look at the diff. Specifically look at whether the update changes any lifecycle scripts, adds new dependencies, or modifies network behavior. For patch updates on packages you’ve used for years this can be a 30-second check. For major version bumps it deserves more time.</p>

<p>The alternative is a fully automated pipeline where a compromised version update merges itself and deploys to your services. Don’t build that pipeline.</p>

<h3 id="6-generate-and-check-npm-provenance">6. Generate and check npm provenance</h3>

<p>As of npm 9.x, packages can be published with <a href="https://www.sigstore.dev/">sigstore</a>-backed provenance attestations that link a published version to a specific Git commit in a specific repository, via a verifiable build chain. When provenance is available:</p>

<div class="language-bash highlighter-rouge"><div class="highlight"><pre class="highlight"><code><span class="c"># Verify registry signatures and provenance attestations for your installed tree:</span>
npm audit signatures

<span class="c"># Or check a single package on the npm website — look for the "provenance" badge</span>
</code></pre></div></div>

<p>Not every package has provenance yet — it requires the publisher to opt in. But for critical packages in your stack, it’s worth checking. A package with attestable provenance is meaningfully harder to backdoor than one without. This is early-stage infrastructure but it’s moving fast.</p>

<h3 id="7-use-short-lived-scoped-npm-tokens">7. Use short-lived, scoped npm tokens</h3>

<p>If you publish packages or if your CI/CD pipeline needs to read private packages:</p>

<div class="language-bash highlighter-rouge"><div class="highlight"><pre class="highlight"><code><span class="c"># Create a scoped token (requires npm account; granular tokens are also available in the npm web UI):</span>
npm token create <span class="nt">--read-only</span>        <span class="c"># for installs only</span>
npm token create <span class="nt">--cidr</span><span class="o">=</span>10.0.0.0/8  <span class="c"># restrict token use to an IP range</span>
</code></pre></div></div>

<p>Tokens with publish scope should have short TTLs and be rotated regularly. If Shai-Hulud runs on your machine and finds an npm token, the scope of that token determines how much damage it can do. A read-only token can’t publish. A publish token with a 24-hour TTL buys you a detection window.</p>

<p>Store tokens in your secrets manager, not in <code class="language-plaintext highlighter-rouge">.npmrc</code> files committed to source control or left in plaintext in environment variables. (If you’re using a homelab secrets manager — Vaultwarden, HashiCorp Vault, whatever — npm tokens belong there.)</p>

<h3 id="8-sbom-generation">8. SBOM generation</h3>

<p>Software Bill of Materials — a machine-readable inventory of every component in your build — is increasingly a compliance requirement for serious projects and useful for homelabs that care about what they’re actually running:</p>

<div class="language-bash highlighter-rouge"><div class="highlight"><pre class="highlight"><code><span class="c"># Generate an SBOM in CycloneDX format:</span>
npx @cyclonedx/cyclonedx-npm <span class="nt">--output-file</span> sbom.json

<span class="c"># Or in SPDX format:</span>
npx spdx-sbom-generator
</code></pre></div></div>

<p>This is more useful for auditing what you have than for real-time attack prevention — but it gives you a baseline. When an incident occurs, you can answer “did we depend on that package?” in seconds rather than hours. I’ll cover SBOMs in more depth in a future post.</p>

<hr />

<div class="sidebar-note">
  <p><strong>How I run mine.</strong></p>

  <p>Lockfiles are committed everywhere, no exceptions. Anything that runs in CI uses <code class="language-plaintext highlighter-rouge">npm ci</code>, not <code class="language-plaintext highlighter-rouge">npm install</code>. Scripts are off by default in automated installs; I re-enable selectively for packages that genuinely need them.</p>

  <p>I have an automated dependency patcher — something like Renovate, though customized — but it doesn’t auto-merge. It opens PRs that I review before they land. Patch updates on packages I know well get a quick look. Anything touching a lifecycle script gets more scrutiny.</p>

  <p>Secrets are never in the build. npm tokens and any credential that could end up on a machine that runs npm installs live in a secrets manager, not in dotfiles. CI gets short-lived tokens with the minimum scope the task actually requires.</p>

  <p>It’s not airtight — no homelab setup is — but it means a compromise would have to work harder and would generate some noise I’d notice.</p>
</div>

<hr />

<h2 id="cross-reference">Cross-reference</h2>

<p>If you’re thinking about detection for supply-chain attacks — catching malicious network calls after the fact, spotting TruffleHog running where it shouldn’t — that’s covered in the detection engineering post: /04-detection-engineering/. And if you want to understand how threat intelligence fits into knowing <em>which</em> packages to watch before they show up in advisories, that’s /03-threat-intel/.</p>

<hr />

<h2 id="the-takeaway">The Takeaway</h2>

<p>The honest version of this:</p>

<p><strong>Commit lockfiles and use <code class="language-plaintext highlighter-rouge">npm ci</code>.</strong> This is free and takes ten minutes to set up. It doesn’t prevent attacks in your pinned version but it stops you from silently drifting into a compromised one.</p>

<p><strong>Run scripts off by default in CI.</strong> The attack surface for supply-chain attacks in npm is the postinstall hook. Take it away where you can.</p>

<p><strong>Review dependency updates before they merge.</strong> Not every update, not every line — but someone with eyes should look at what changed before a new version hits your running services. Automated merging of a compromised update is how a two-hour window of malicious package availability becomes a persistent compromise.</p>

<p><strong>Treat your npm tokens like passwords.</strong> Scoped, short-lived, in a secrets manager. If Shai-Hulud finds a read-only install token, it can steal it. If it’s also a publish token, it becomes a propagation vector.</p>

<p>You can’t audit every dependency in your tree. The maintainer graph is too large and too distributed for that to be realistic. What you can do is make compromise harder to silently land (lockfiles, scripts off), make it more likely you notice when something changes (Socket.dev, diff reviews), and limit what an attacker gets if they do reach your machine (scoped tokens, secrets hygiene).</p>

<p>Supply-chain attacks are loud at the ecosystem level and silent at the individual machine level. The defenses above are about flipping that ratio: making them louder where you can actually see them.</p>

<hr />

<p><em>This post is part of the <a href="/series/dispatches">Dispatches</a> track — topical deep-dives outside the main “Start Your AI Homelab” series.</em></p>]]></content><author><name>MrK</name></author><summary type="html"><![CDATA[How JavaScript supply-chain attacks actually work — from event-stream to the 2025 self-replicating npm worm — and the handful of habits that keep your homelab from becoming a casualty.]]></summary></entry><entry><title type="html">Automation &amp;amp; SOAR: Closing the Loop</title><link href="https://kc-explore.github.io/05-automation-soar/" rel="alternate" type="text/html" title="Automation &amp;amp; SOAR: Closing the Loop" /><published>2026-06-13T00:00:00+00:00</published><updated>2026-06-13T00:00:00+00:00</updated><id>https://kc-explore.github.io/05-automation-soar</id><content type="html" xml:base="https://kc-explore.github.io/05-automation-soar/"><![CDATA[<p>Five posts in, you have detection rules firing alerts, threat intel feeds enriching your context, and a hunting process that surfaces things your rules missed. What you probably also have is a growing pile of alerts that need the same five manual steps every single time: look up the IP, check the hash, figure out whether the asset is important, open a ticket, tell someone.</p>

<p>That’s automation work, not analyst work. SOAR is how you take it back.</p>

<p>This post covers Security Orchestration, Automation, and Response at the home-lab scale — what it actually is, what to automate first, and the guardrail you must not skip. Because you can absolutely automate your way into deleting a running service or locking yourself out of your own accounts. That’s a fun story to tell later, less fun to live through.</p>

<hr />

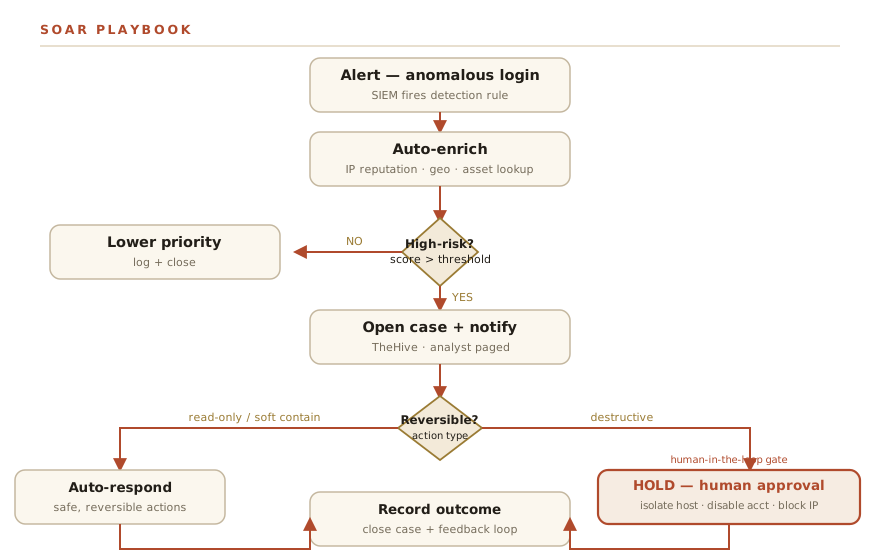
<figure class="diagram">
  <img src="/assets/diagrams/blue-team/soar-flow.svg" alt="A SOAR playbook flow: an alert triggers automatic enrichment, a risk decision routes low-risk events to logging and high-risk to a case, and destructive responses are gated behind human approval before execution." />
  <figcaption>A SOAR playbook — automate enrichment freely, gate anything destructive behind a human.</figcaption>
</figure>

<hr />

<h2 id="what-soar-actually-means">What SOAR Actually Means</h2>

<p>SOAR is three things bundled into one acronym, and they’re worth separating because they have very different risk profiles:</p>

<p><strong>Security Orchestration</strong> — connecting your tools so they can talk to each other. Your SIEM sends an alert to your case management system, which calls your threat intel platform, which writes results back to the case. Orchestration is plumbing. It’s low-risk and high-value.</p>

<p><strong>Automation</strong> — replacing manual steps with scripts. Instead of you tabbing over to VirusTotal and copy-pasting a hash, a workflow does it in two seconds and writes the result into the alert record. Automation is also generally low-risk when it stays read-only.</p>

<p><strong>Response</strong> — actually doing something to your environment in reaction to an alert. Blocking an IP at the firewall. Disabling a user account. Isolating a host from the network. This is where risk gets real.</p>

<p>Most SOAR tutorials gloss over this distinction and treat it like a smooth continuum. It’s not. The gap between “look up a reputation score” and “kill a running session” is significant, and how you handle that gap determines whether automation helps you or causes its own incident.</p>

<p>At home, you’re running SOAR with a team of one. That means there’s nobody else to check your playbook before it runs, and “I’ll just automate the response too” is a shorter path to a self-inflicted outage than you’d think.</p>

<hr />

<h2 id="what-to-automate-first">What to Automate First</h2>

<p>The highest-leverage automation targets are the things that are high-volume, low-stakes, and identical every time. In practice that’s four categories:</p>

<p><strong>Enrichment</strong> — every alert that mentions an IP, domain, file hash, or email address needs the same context: is it known-bad, where is it geographically, when was it last seen in threat intel, is the asset it touched important? Automating enrichment means every alert arrives with that context already filled in. Your triage time drops from ten minutes to thirty seconds because the legwork is done.</p>

<p><strong>Alert triage and deduplication</strong> — if the same external scanner hits your SSH port forty times in an hour, that’s one event, not forty alerts. Automation can correlate and deduplicate before anything reaches your queue. A clean queue is a queue you’ll actually work.</p>

<p><strong>Notifications</strong> — alerting the right person (in a home lab, that’s you) in the right channel at the right time. A high-severity alert at 2 AM probably wants a push notification. A low-severity log anomaly probably wants a daily digest. Routing decisions like these are easy to codify.</p>

<p><strong>Case and ticket creation</strong> — when something does need human attention, the case should already exist with enrichment attached by the time you look at it. Creating cases manually is overhead that adds no analytical value.</p>

<p><strong>Clear-cut containment</strong> — the narrowest category, and the one with the most caveats. A small number of automated responses are safe enough to run without human review: adding an IP to a watchlist, dropping a connection at the network perimeter when a feed has already confirmed it’s active C2 infrastructure. But the line here is narrow. More on that in the next section.</p>

<p>The other 20% — the cases that need judgment, the alerts with ambiguous context, the response actions that affect running services — those need a human. Automation should be buying back time so that human can think, not trying to replace the thinking.</p>

<hr />

<h2 id="the-playbook-concept">The Playbook Concept</h2>

<p>A playbook is just a documented, executable workflow: given trigger X, do steps A, B, C, then record what happened.</p>

<p>The basic structure is consistent regardless of the tool:</p>

<ol>
  <li><strong>Trigger</strong> — something fires. An alert from your SIEM, a new entry in a threat intel feed, a threshold crossed in your metrics, a file landing in a watched directory.</li>
  <li><strong>Enrich</strong> — gather context automatically. IP reputation, domain age, hash verdict, asset criticality, related historical events.</li>
  <li><strong>Decide</strong> — based on what enrichment found, route the alert. Is this obviously benign? Close it with a note. Is this high-confidence malicious? Escalate. Everything else: queue for review.</li>
  <li><strong>Act</strong> — execute the appropriate response. Read-only (log, notify, create a case) or active (contain, block) — more on this shortly.</li>
  <li><strong>Record and feed back</strong> — write outcomes back to the case, close the loop. What happened, what was decided, what was done, by whom or by what. This record is what you use to tune the playbook later.</li>
</ol>

<p>The record-and-feedback step is where most home implementations cut corners, and it’s the one that compounds. Playbooks that don’t record outcomes can’t improve. Six months in you have no idea whether the enrichment step is actually informing decisions or just adding noise.</p>

<hr />

<div class="callout">
  <p><strong>The guardrail rule — read this before you automate anything.</strong></p>

  <p>Destructive and irreversible actions must always require explicit human approval before execution. No exceptions.</p>

  <p>What counts as destructive or irreversible: disabling a user account, isolating a host from the network, deleting a file, blocking an IP at your router or firewall, terminating a running process or container. Anything that you cannot trivially undo in under two minutes.</p>

  <p>What can run automatically without human approval: lookups, enrichment, notifications, case creation, adding to a watchlist, generating a report.</p>

  <p>The failure mode here is real. A false-positive detection that auto-isolates a host can bring down a running service. An automation bug that disables accounts can lock you out of your own infrastructure. These things happen in production SOCs with teams of engineers reviewing playbooks. At home, with one person, the blast radius of a bad automation decision is the entire lab.</p>

  <p>Automate the boring stuff. Gate the sharp stuff. This is not excessive caution — it’s the right threat model for a solo operator.</p>
</div>

<hr />

<h2 id="tools-worth-knowing">Tools Worth Knowing</h2>

<p>This is the part where I give you a table instead of a wall of text, because your home threat model doesn’t need a 3000-word comparison of enterprise SOAR platforms.</p>

<table>
  <thead>
    <tr>
      <th>Tool</th>
      <th>What it is</th>
      <th>Effort to deploy</th>
    </tr>
  </thead>
  <tbody>
    <tr>
      <td><strong>Shuffle</strong></td>
      <td>Open-source SOAR — visual playbook builder, 800+ app integrations, REST hooks. Closest thing to an enterprise SOAR without the price tag.</td>
      <td>Medium — Docker Compose, some YAML wrangling</td>
    </tr>
    <tr>
      <td><strong>Tines</strong></td>
      <td>Commercial SOAR with a genuinely generous free community tier. Polished UI, good docs, lots of examples.</td>
      <td>Low — hosted, no infra to manage</td>
    </tr>
    <tr>
      <td><strong>n8n</strong></td>
      <td>General-purpose workflow automation. Not purpose-built for security, but exceptional glue between tools — especially for enrichment pipelines and notifications. Self-hostable.</td>
      <td>Low to medium — Docker, clean web UI</td>
    </tr>
    <tr>
      <td><strong>TheHive</strong></td>
      <td>Open-source case management platform. Where alerts become cases, cases get enrichment attached, and analysts track what happened. Pairs with Cortex for automated analysis.</td>
      <td>Medium — Docker stack, database setup</td>
    </tr>
    <tr>
      <td><strong>Cortex</strong></td>
      <td>TheHive’s analysis engine. Runs “analyzers” — connectors to enrichment services — automatically when a case is created. Deep VirusTotal, Shodan, and threat intel integrations.</td>
      <td>Medium — typically deployed alongside TheHive</td>
    </tr>
  </tbody>
</table>

<p>The MISP integration from <a href="/03-threat-intel/">part 3</a> fits here naturally — Cortex has a MISP analyzer, and Shuffle has native MISP actions. Once your threat intel platform is connected to your case management and your case management is connected to your automation layer, enrichment starts flowing without manual steps.</p>

<p>For a home lab starting point: n8n for orchestration and notification plumbing, TheHive for case management, and Shuffle when you want to build more structured playbooks. You don’t need all three on day one.</p>

<hr />

<h2 id="a-worked-playbook-anomalous-login-alert">A Worked Playbook: Anomalous Login Alert</h2>

<p>Here’s a concrete example end to end. The scenario: your detection rule from <a href="/04-detection-engineering/">part 4</a> fires on a login from an unusual source IP — either a new location, an unusual hour, or an IP that doesn’t fit the normal pattern for this account.</p>

<p><strong>Step 1 — Alert fires, playbook triggers.</strong>
The SIEM (or log analysis tool, or whatever you’re running) generates an alert with: source IP, account, timestamp, source application.</p>

<p><strong>Step 2 — Auto-enrich the source IP.</strong>
The playbook immediately fires off parallel lookups:</p>
<ul>
  <li>ThreatFox / OTX for known-bad reputation</li>
  <li>Geo IP lookup for country, city, ASN</li>
  <li>Your internal asset inventory: is this IP in your known-good list?</li>
</ul>

<p>This takes three to eight seconds. No human involvement.</p>

<p><strong>Step 3 — Evaluate travel plausibility.</strong>
If you have a previous login on record, the playbook checks: could this person physically be in both locations given the time delta? A login from your home city and then Toronto two hours later — plausible. A login from home and then Singapore four minutes later — not plausible.</p>

<p><strong>Step 4 — Risk decision.</strong></p>

<p><em>If the IP is in a threat feed or the travel is impossible:</em> the alert is classified high-risk. Proceed to Step 5.</p>

<p><em>If the IP is clean and the travel is plausible:</em> lower priority. Log the event, attach the enrichment, close the alert with a note. No human required.</p>

<p><strong>Step 5 — Open a case, notify.</strong>
TheHive gets a new case created automatically, with all enrichment attached. You get a push notification with a summary: source IP, reputation verdict, geo, the travel-plausibility result, and a link to the case.</p>

<p>At this point, you are informed and a case exists. Nothing destructive has happened yet.</p>

<p><strong>Step 6 — Human decision gate.</strong>
The case in TheHive shows two action buttons: <strong>Approve containment</strong> or <strong>Dismiss as false positive</strong>.</p>

<p>If you dismiss it: the case closes, the enrichment is logged, the playbook records your decision.</p>

<p>If you approve: the playbook runs the response — in this example, ending the active session for that account and flagging it for password review. Because you clicked a button to authorize it, you knew it was coming and can reverse it if needed.</p>

<p><strong>Step 7 — Record outcome.</strong>
Whatever happened — dismissed, confirmed, contained — gets written back to the case. Time from alert to decision, who acted, what ran. This is your audit trail and your playbook improvement data.</p>

<p>The gate at Step 6 is the entire point. Enrichment runs automatically. Notification runs automatically. Containment does not run automatically. A human was in the loop for the step that mattered.</p>

<hr />

<h2 id="the-flowchart">The Flowchart</h2>

<pre><code class="language-mermaid">flowchart TD
  A[Alert: anomalous login] --&gt; B[Auto-enrich: IP reputation, geo, asset]
  B --&gt; C{Known-bad or high-risk?}
  C --&gt;|No| D[Lower priority + log + close]
  C --&gt;|Yes| E[Open case in TheHive + notify]
  E --&gt; F{Is the response reversible?}
  F --&gt;|Read-only / soft contain| G[Auto-respond]
  F --&gt;|Destructive / irreversible| H[Hold for human approval]
  H --&gt; I[Analyst approves]
  I --&gt; J[Execute response]
  G --&gt; K[Record outcome + feedback]
  J --&gt; K
</code></pre>

<hr />

<div class="sidebar-note">
  <p><strong>How I run mine.</strong></p>

  <p>The enrichment layer runs automatically on anything that fires — reputation lookups, geo, asset context — using n8n as the glue between alert sources and TheHive. A new case lands with context already filled in, which is the single change that made triage feel manageable instead of exhausting.</p>

  <p>Notifications hit me in one channel at one severity threshold. I used to alert on too many things, which meant I started ignoring alerts, which is worse than no alerting at all. Tuning it down to “only tell me things that need a decision” was the right call.</p>

  <p>For response, nothing runs without my explicit click. The button exists in the case. I have not yet wished I’d automated past it.</p>
</div>

<hr />

<h2 id="closing-the-loop--the-whole-series">Closing the Loop — The Whole Series</h2>

<p>Here’s what the five disciplines look like when they’re connected:</p>

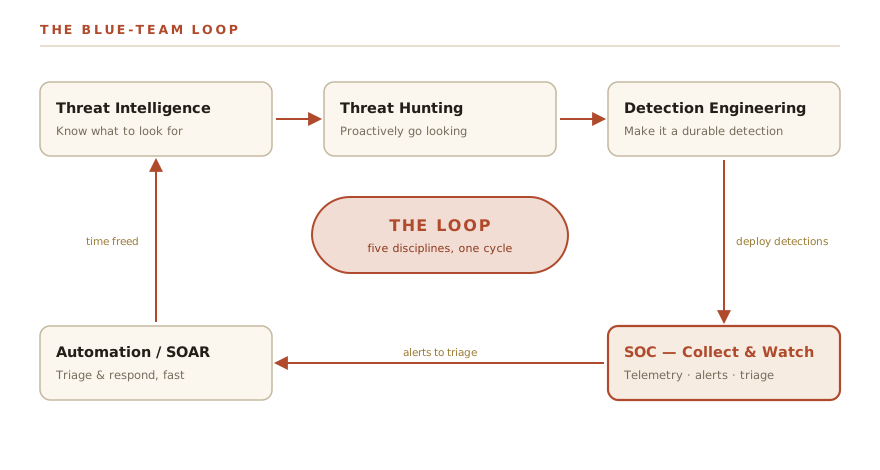
<p>Automation buys back the time you were spending on repetitive triage. You spend that time hunting — going looking for things your rules haven’t caught yet, the way we covered in <a href="/02-threat-hunting/">part 2</a>. The things you find while hunting become detections — you take the pattern, convert it to a rule, and codify it, which is what <a href="/04-detection-engineering/">part 4</a> was about. Those detections fire alerts. Automation triages the alerts. And so it runs.</p>

<p>The five disciplines aren’t a checklist you work through once. They’re a loop that feeds itself. Better detections generate cleaner alerts. Cleaner alerts make automation more reliable. More reliable automation frees analyst time. Analyst time goes to hunting. Hunting improves detection.</p>

<p>That loop is what a mature security practice actually looks like, regardless of whether it’s running in a home lab or an enterprise. The tools are different. The logic isn’t.</p>

<p>The map at <a href="/00-why-a-home-soc/">the start of this series</a> laid all five disciplines out before we built any of them. Go back and read it now if you want — it hits differently once you’ve worked through each post.</p>

<hr />

<h2 id="where-to-go-from-here">Where to Go From Here</h2>

<p>This is the end of the Blue Team Homelab series, but it’s not the end of the build.</p>

<p>If I were starting fresh with what I know now, I’d pick one of these five disciplines — whichever connects most directly to a real problem you have today — and go deep on it before touching the others. Not because the others don’t matter. Because shallow coverage of all five teaches you less than genuine fluency in one, and fluency in one pulls you naturally into the next.</p>

<p>The right starting point for most people is detection engineering. Writing a rule and watching it fire on something real is the fastest way to understand why all the other pieces exist. From there, threat intel and hunting expand your scope. Automation scales what you’ve built. But you have to have something worth scaling first.</p>

<p>Pick the thread that pulls hardest. Follow it.</p>

<p>The series starts at <a href="/00-why-a-home-soc/">Why a Home SOC?</a> if you want to send someone to the beginning.</p>

<hr />

<p><em>Previous: <a href="/04-detection-engineering/">Detection engineering: detections as code</a></em></p>]]></content><author><name>MrK</name></author><summary type="html"><![CDATA[The boring 80% of response is automatable. SOAR concepts, playbooks, and enrichment-and-triage automation at home with Shuffle, n8n, and TheHive — with guardrails.]]></summary></entry><entry><title type="html">Detection Engineering: Detections as Code</title><link href="https://kc-explore.github.io/04-detection-engineering/" rel="alternate" type="text/html" title="Detection Engineering: Detections as Code" /><published>2026-06-06T00:00:00+00:00</published><updated>2026-06-06T00:00:00+00:00</updated><id>https://kc-explore.github.io/04-detection-engineering</id><content type="html" xml:base="https://kc-explore.github.io/04-detection-engineering/"><![CDATA[<p>Most security teams have a graveyard of detections. Rules written in a moment of panic after an incident, clicked into the SIEM console, never documented, never tested, and running continuously until someone finally notices they haven’t fired in eighteen months — or worse, they’ve been firing constantly and everyone learned to ignore them. A detection that nobody trusts is worse than no detection: it trains people to ignore the signal.</p>

<p>Detection engineering is the discipline of treating detections like software. Not as one-off queries you configure through a UI and hope for the best, but as a durable product with a lifecycle: authored, reviewed, tested, deployed, tuned, and eventually retired. Everything that makes software maintainable — version control, peer review, automated testing, documented intent — applies here too.</p>

<p>This post works through what that means in practice for a home blue team setup.</p>

<hr />

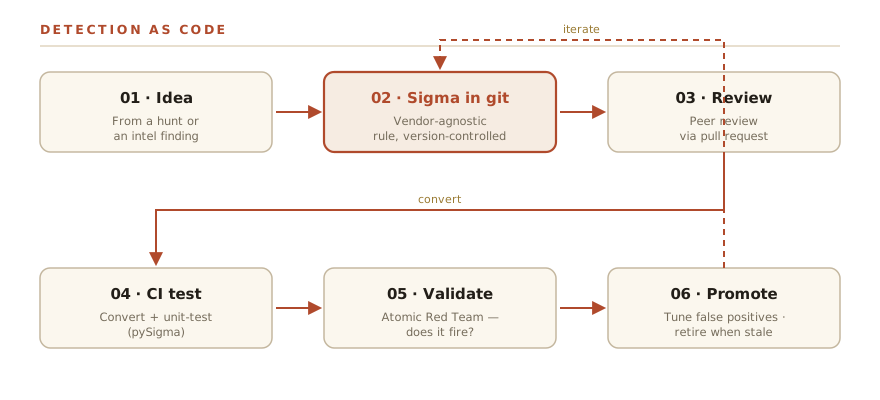
<figure class="diagram">
  <img src="/assets/diagrams/blue-team/detection-pipeline.svg" alt="A detection-as-code pipeline: an idea from a hunt or intel becomes a Sigma rule in git, is peer-reviewed, CI-tested, deployed to the SIEM, validated with Atomic Red Team, then tuned or retired." />
  <figcaption>Detections as code — the same review-test-deploy-tune loop software gets.</figcaption>
</figure>

<hr />

<h2 id="what-detection-engineering-actually-is">What detection engineering actually is</h2>

<p>The term sounds more enterprise than it is. The core idea is simple: a detection is code, and code should be treated like code.</p>

<p>That means:</p>

<ul>
  <li><strong>It lives in version control.</strong> You can see every change, who made it, and why. You can roll back if a change causes noise.</li>
  <li><strong>It has documented intent.</strong> Not just what it looks for, but why — what adversary behaviour it maps to, what it assumes about the environment, what it’s known to miss.</li>
  <li><strong>It’s tested before it goes live.</strong> Not “I ran it and it didn’t error.” Tested as in: someone intentionally triggered the condition and confirmed the detection fired.</li>
  <li><strong>It has an owner.</strong> Detections don’t maintain themselves. Someone is responsible for knowing whether it still makes sense six months from now.</li>
</ul>

<p>The alternative — clicking a detection into a SIEM console with no documentation, no test, and no review — produces a pile of rules that nobody understands well enough to tune. When the environment changes, nobody knows which detections will break. When something fires at 2 AM, nobody remembers what the rule was supposed to catch.</p>

<p>For a home lab, the stakes are lower, but the discipline is worth building. Learning to do it right when the consequences are minor means you’ll do it right when the consequences aren’t.</p>

<hr />

<h2 id="detections-as-code">Detections as code</h2>

<p>The practical implementation of detection-as-code looks like this:</p>

<p><strong>Every detection lives in a git repository.</strong> A directory per detection, a YAML file with the rule, and a short document explaining what it is and why it exists. PRs to add or change detections get reviewed before they’re merged. The merge history is an audit trail.</p>

<p><strong>CI runs on every PR.</strong> At minimum, a syntax check. If you’re using Sigma (more on that below), CI converts the rule to your SIEM’s query language and confirms it compiles without error. If you’ve written unit tests — input events that should and shouldn’t match — CI runs those too.</p>

<p><strong>Deployment is automated from main.</strong> Merging to main triggers a sync to your SIEM. You never manually paste a rule into a console. The console reflects exactly what’s in git, no more and no less.</p>

<p><strong>Everything is auditable.</strong> A detection that exists in the SIEM but not in git is a defect. A rule edited directly in the console is a defect. The git repo is the source of truth, and anything that diverges from it is wrong.</p>

<p>This sounds heavyweight for a homelab. In practice, you can implement a lightweight version with a single git repo, a GitHub Actions workflow that runs <code class="language-plaintext highlighter-rouge">sigma-cli</code> on push, and a script that syncs rules to your SIEM on merge. The friction of doing it this way is low. The payoff — knowing exactly what you’re running and why — is real.</p>

<hr />

<h2 id="sigma-write-once-convert-anywhere">Sigma: write once, convert anywhere</h2>

<p>Sigma is a generic, vendor-agnostic detection rule format. You write a rule in YAML once, and a converter tool translates it into the query language your specific SIEM understands — whether that’s Splunk SPL, Elasticsearch Query DSL, OpenSearch, QRadar, or something else. This matters because it means your detection library isn’t married to one product.</p>

<p>A Sigma rule has a handful of required sections: metadata about the rule (title, status, description), a <code class="language-plaintext highlighter-rouge">logsource</code> block that says what kind of events this rule applies to, a <code class="language-plaintext highlighter-rouge">detection</code> block that defines what to look for, and metadata like <code class="language-plaintext highlighter-rouge">level</code> (low, medium, high, critical) and <code class="language-plaintext highlighter-rouge">tags</code> to map to MITRE ATT&amp;CK techniques.</p>

<p>Here’s a small, real example — detecting the kind of local reconnaissance that shows up early in many intrusions: a user running <code class="language-plaintext highlighter-rouge">whoami</code>, <code class="language-plaintext highlighter-rouge">net user</code>, or <code class="language-plaintext highlighter-rouge">net localgroup</code> in quick succession.</p>

<div class="language-yaml highlighter-rouge"><div class="highlight"><pre class="highlight"><code><span class="na">title</span><span class="pi">:</span> <span class="s">Suspicious Local Recon Commands</span>
<span class="na">id</span><span class="pi">:</span> <span class="s">7b3d1a0f-912c-4e8d-a9b2-c5f87d6e2301</span>
<span class="na">status</span><span class="pi">:</span> <span class="s">experimental</span>
<span class="na">description</span><span class="pi">:</span> <span class="pi">&gt;</span>
  <span class="s">Detects sequential execution of common local reconnaissance commands</span>
  <span class="s">used to enumerate the current user, local accounts, and group memberships.</span>
  <span class="s">Typically seen in the early stages of post-exploitation.</span>
<span class="na">references</span><span class="pi">:</span>
  <span class="pi">-</span> <span class="s">https://attack.mitre.org/techniques/T1033/</span>
  <span class="pi">-</span> <span class="s">https://attack.mitre.org/techniques/T1069/001/</span>
<span class="na">author</span><span class="pi">:</span> <span class="s">MrK</span>
<span class="na">date</span><span class="pi">:</span> <span class="s">2026-08-14</span>
<span class="na">tags</span><span class="pi">:</span>
  <span class="pi">-</span> <span class="s">attack.discovery</span>
  <span class="pi">-</span> <span class="s">attack.t1033</span>
  <span class="pi">-</span> <span class="s">attack.t1069.001</span>
<span class="na">logsource</span><span class="pi">:</span>
  <span class="na">category</span><span class="pi">:</span> <span class="s">process_creation</span>
  <span class="na">product</span><span class="pi">:</span> <span class="s">windows</span>
<span class="na">detection</span><span class="pi">:</span>
  <span class="na">selection</span><span class="pi">:</span>
    <span class="na">CommandLine|contains</span><span class="pi">:</span>
      <span class="pi">-</span> <span class="s">whoami</span>
      <span class="pi">-</span> <span class="s1">'</span><span class="s">net</span><span class="nv"> </span><span class="s">user'</span>
      <span class="pi">-</span> <span class="s1">'</span><span class="s">net</span><span class="nv"> </span><span class="s">localgroup'</span>
  <span class="na">condition</span><span class="pi">:</span> <span class="s">selection</span>
<span class="na">falsepositives</span><span class="pi">:</span>
  <span class="pi">-</span> <span class="s">Legitimate sysadmin activity</span>
  <span class="pi">-</span> <span class="s">Automated IT management scripts</span>
<span class="na">level</span><span class="pi">:</span> <span class="s">low</span>
</code></pre></div></div>

<p>A few things worth noting about this structure. The <code class="language-plaintext highlighter-rouge">logsource</code> section — <code class="language-plaintext highlighter-rouge">category: process_creation, product: windows</code> — tells the converter which data source this applies to. The <code class="language-plaintext highlighter-rouge">detection.selection</code> defines what a matching event looks like; <code class="language-plaintext highlighter-rouge">condition: selection</code> means “alert when any event matches the selection.” For more complex rules you can combine multiple named selections with boolean logic: <code class="language-plaintext highlighter-rouge">condition: selection1 and not filter</code>.</p>

<p>The <code class="language-plaintext highlighter-rouge">falsepositives</code> section isn’t enforced by the tooling. It’s documentation for whoever is looking at an alert at 2 AM. That matters.</p>

<p>To convert this to an Elasticsearch query:</p>

<div class="language-bash highlighter-rouge"><div class="highlight"><pre class="highlight"><code><span class="c"># Install sigma-cli and the Elasticsearch backend</span>
pip <span class="nb">install </span>sigma-cli
sigma plugin <span class="nb">install </span>elasticsearch

<span class="c"># Convert the rule</span>
sigma convert <span class="nt">-t</span> elasticsearch <span class="nt">-p</span> ecs-windows recon-commands.yml
</code></pre></div></div>

<p>The output is a query you can paste directly into Elastic. If you’re using Splunk, swap <code class="language-plaintext highlighter-rouge">-t elasticsearch</code> for <code class="language-plaintext highlighter-rouge">-t splunk</code>. The rule itself doesn’t change.</p>

<hr />

<h2 id="the-detection-lifecycle">The detection lifecycle</h2>

<p>A detection has a life beyond the moment you write it. Understanding the full arc changes how you build them.</p>

<p><strong>Idea / hypothesis.</strong> Most good detections start with a question: “if an attacker did X, what would that look like in our logs?” The source might be a threat hunt (you found something suspicious, and now you want an automated signal for it — see the <a href="/02-threat-hunting/">threat hunting post</a>), or a piece of threat intelligence (a TTP is associated with a relevant threat actor — see <a href="/03-threat-intel/">the intel post</a>), or a post-mortem from an actual incident. This is the hypothesis stage: you have a theory about what bad looks like.</p>

<p><strong>Develop.</strong> Turn the hypothesis into a detection rule. Write the Sigma YAML. Write the intent documentation. Write down what you think it will miss and what you expect to generate false positives on.</p>

<p><strong>Test.</strong> Before this goes anywhere near production, you need to confirm it actually works. More on this below. Skip this step and you have a hypothesis masquerading as a control.</p>

<p><strong>Deploy.</strong> Merge to main. The CI/CD pipeline converts and syncs it to your SIEM. The detection is now live.</p>

<p><strong>Tune.</strong> The first weeks in production reveal the false positive rate. Legitimate admin scripts that match the pattern. Monitoring agents that look suspicious. Each false positive is a tuning opportunity: add a filter, tighten the condition, document the known-good pattern. Every tuning change goes through the same PR process.</p>

<p><strong>Retire.</strong> The technology being monitored was decommissioned. A better, broader detection superseded this one. The false positive rate is unmanageable and the signal-to-noise ratio never improved. Not every detection earns indefinite production status. Retiring a detection is a deliberate decision, not benign neglect — and it’s healthier than keeping a noisy rule that everyone learns to ignore.</p>

<hr />

<h2 id="the-ads-framework">The ADS framework</h2>

<p>Palantir published the Alerting &amp; Detection Strategy (ADS) framework as a structured template for documenting what a detection is and why it exists. The idea is that every detection should have a corresponding ADS document, and that document should contain enough context for a stranger to understand, maintain, and eventually retire the rule.</p>

<p>The sections:</p>

<p><strong>Goal.</strong> One or two sentences. What adversary behaviour or event does this detection target?</p>

<p><strong>Categorization.</strong> The MITRE ATT&amp;CK technique (or techniques) this maps to. Not because ATT&amp;CK is gospel, but because it’s a shared vocabulary that tells you where in the kill chain this fires.</p>

<p><strong>Strategy Abstract.</strong> How does the detection work? What data source does it use? What does a matching event look like?</p>

<p><strong>Technical Context.</strong> What do you need to know about the environment for this detection to make sense? What logging must be enabled? What systems must be generating the relevant events?</p>

<p><strong>Blind Spots and Assumptions.</strong> What does this detection miss? If the attacker runs the same recon commands as a service account that’s in your allowlist, this won’t fire. Say so. If this assumes Windows event ID 4688 is enabled, say so. Making the blind spots explicit is more valuable than pretending they don’t exist.</p>

<p><strong>False Positives.</strong> Known benign conditions that will match. Sysadmin activity, monitoring agents, automated scripts. The more specific the better — “IT management scripts” is less useful than “the Ansible playbook <code class="language-plaintext highlighter-rouge">baseline-audit.yml</code> generates this event on every run.”</p>

<p><strong>Validation.</strong> How was this detection tested? What tool, what technique, what result? This section closes the loop on whether the detection actually fires.</p>

<p><strong>Priority.</strong> The severity level when this fires and how it should be treated in triage.</p>

<p><strong>Response.</strong> What should happen when this fires? Not an exhaustive runbook, but the key questions to answer first.</p>

<p>Writing an ADS document for every detection takes maybe fifteen minutes. What it buys you is a detection that someone else — or future you — can actually maintain. A rule file with no documentation is a black box. With the ADS template it’s a defensible artifact.</p>

<hr />

<h2 id="testing-your-detections">Testing your detections</h2>

<p>This is where most home blue teamers skip a step, and it’s the most important step in the whole pipeline.</p>

<p><strong>Atomic Red Team</strong> is a library of small, targeted tests — “atomics” — mapped directly to MITRE ATT&amp;CK techniques. Each atomic is a minimal, documented way to trigger a specific behaviour. Run the atomic, check whether your detection fired. If it didn’t fire, you have a hypothesis, not a control.</p>

<div class="language-bash highlighter-rouge"><div class="highlight"><pre class="highlight"><code><span class="c"># Install Atomic Red Team (PowerShell, on a test Windows machine)</span>
IEX <span class="o">(</span>IWR <span class="s1">'https://raw.githubusercontent.com/redcanaryco/invoke-atomicredteam/master/install-atomicredteam.ps1'</span> <span class="nt">-UseBasicParsing</span><span class="o">)</span>

<span class="c"># Run the atomic for T1033 - System Owner/User Discovery</span>
Invoke-AtomicTest T1033 <span class="nt">-TestNumbers</span> 1

<span class="c"># Run the atomic for T1069.001 - Local Groups</span>
Invoke-AtomicTest T1069.001 <span class="nt">-TestNumbers</span> 1
</code></pre></div></div>

<p>If your detection fires: promote the rule to production. Document the validation result in the ADS document. If it doesn’t fire: go back to the rule. The log source might not be generating the expected event. The query logic might be wrong. Something is missing. The atomic doesn’t lie — if the behaviour happened and the detection didn’t fire, the gap is in your detection, not in the test.</p>

<p><strong>CALDERA</strong> is a step up: a full adversary emulation platform where you define an operation (a sequence of ATT&amp;CK techniques) and let it run against a test host, then check how many steps your detection coverage caught. This is overkill for a first homelab detection setup, but it becomes useful once you have enough rules to want to measure coverage systematically.</p>

<p>The important mindset shift: testing isn’t optional polish at the end of the process. It’s the step that determines whether you have a detection or a guess. Run the test before you put the rule in production. Every time.</p>

<hr />

<div class="callout">
  <p><strong>Field note: a detection you haven’t tested is a hypothesis, not a control.</strong></p>

  <p>The rule being in the SIEM does not mean it works. The rule having no errors does not mean it fires on the right events. The only thing that means a detection works is: you intentionally triggered the condition it’s supposed to catch, and it caught it. Until you’ve done that, you have a hypothesis that happens to live in production. The Atomic Red Team library exists specifically to make this test cheap and repeatable. There is no excuse for skipping it.</p>
</div>

<hr />

<h2 id="false-positives-are-the-real-enemy">False positives are the real enemy</h2>

<p>A detection that fires accurately on malicious behaviour is useful. A detection that fires on everything is noise, and noise is how alerts become something people learn to click through without reading.</p>

<p>False positive tuning is ongoing, not a one-time activity. When a detection fires in production and the activity turns out to be benign, that’s not a failure — it’s data. Add the filter. Document the known-good pattern in the ADS. Retest. Merge.</p>

<p>The thing to watch for is detection hoarding: keeping noisy rules active because they feel safer than retiring them. A detection with a 99% false positive rate costs your future self more attention than it’s worth. If a detection consistently produces noise and you’ve tried to tune it and it’s still noisy, retire it. Write a better one if the underlying hypothesis is still valid.</p>

<p>The metric that matters isn’t “how many detections do we have.” It’s “how often does a detection fire on something worth looking at.” Fewer high-fidelity rules beat a large collection of unreliable ones. This is uncomfortable to accept because more rules feel like better coverage, but the analyst who’s learned to ignore the noise in a high-volume SIEM is more dangerous than an analyst with a smaller, trustworthy signal.</p>

<hr />

<pre><code class="language-mermaid">flowchart LR
  A[Hunt or intel finding] --&gt; B[Write Sigma rule in git]
  B --&gt; C[Peer review / PR]
  C --&gt; D[CI: convert + unit test]
  D --&gt; E[Deploy to SIEM]
  E --&gt; F[Validate: Atomic Red Team]
  F --&gt; G{Fires cleanly?}
  G --&gt;|Yes| H[Promote to production]
  G --&gt;|No| B
  H --&gt; I[Monitor FP rate + tune]
  I --&gt; J{Still earning its keep?}
  J --&gt;|No| K[Retire]
</code></pre>

<hr />

<div class="sidebar-note">
  <p><strong>How I run mine.</strong></p>

  <p>Detections live in a git repo, one directory per rule. The directory contains the Sigma YAML and a short markdown file with the detection’s intent, assumptions, known false positives, and test result. A GitHub Actions workflow converts every rule on push using sigma-cli and fails the build if any rule doesn’t parse clean.</p>

  <p>I run Atomic Red Team tests on a dedicated Windows VM that I snapshot before each test and restore after. The snapshot-restore loop means the test host is always clean and the results are reproducible. When a new rule passes validation, I note the atomic test number and result in the ADS document before merging.</p>

  <p>I try not to have rules I can’t explain. If a detection fires and I’d have to go re-read the rule to understand what it’s doing, it needs better documentation. The standard I aim for: a rule I wrote six months ago should be self-explanatory when it fires at 2 AM.</p>
</div>

<hr />

<h2 id="a-note-on-coverage-vs-fidelity">A note on coverage vs. fidelity</h2>

<p>The natural progression is to want more coverage — a detection for every ATT&amp;CK technique. Resist this. Coverage without fidelity is how you build a SIEM full of noise.</p>

<p>A better approach: start with a handful of high-signal, high-fidelity detections for behaviours that are almost never benign. Process injection, LSASS access, unusual parent-child process relationships, outbound connections from processes that have no business making them. Get those right and tuned before expanding. Each new rule you add is a maintenance burden — make sure it earns its keep.</p>

<p>The ATT&amp;CK navigator is useful here as a visual gap analysis tool, but use it as a map, not a checklist. The goal is trustworthy coverage of the things that matter for your threat model, not coloured cells in a spreadsheet.</p>

<hr />

<h2 id="next-up">Next Up</h2>

<p><a href="/05-automation-soar/">Automation and SOAR: making your homelab respond, not just alert</a> — when detections fire, what happens next shouldn’t depend on a human being awake.</p>

<hr />

<p><em>Previous: <a href="/03-threat-intel/">Threat intelligence that isn’t just a feed</a></em></p>]]></content><author><name>MrK</name></author><summary type="html"><![CDATA[Treat detections like software — version-controlled, tested, and tuned. Sigma rules, the detection lifecycle, the ADS framework, and validating with Atomic Red Team.]]></summary></entry><entry><title type="html">Threat Intelligence That Isn’t Just a Feed</title><link href="https://kc-explore.github.io/03-threat-intel/" rel="alternate" type="text/html" title="Threat Intelligence That Isn’t Just a Feed" /><published>2026-05-30T00:00:00+00:00</published><updated>2026-05-30T00:00:00+00:00</updated><id>https://kc-explore.github.io/03-threat-intel</id><content type="html" xml:base="https://kc-explore.github.io/03-threat-intel/"><![CDATA[<p>The most common misunderstanding about threat intelligence is baked into the name people use for it. “Subscribe to a threat feed” is how most people phrase it. Subscribe. As if intelligence is something you receive passively, like a newsletter, and the receiving is the point.</p>

<p>It isn’t. Intelligence is a process that produces decisions. The output isn’t a list of bad IP addresses — it’s an analyst saying “based on what I know about this adversary’s behaviour, we should be watching for X.” The feed is raw material at best. On its own, it’s noise with a confidence problem.</p>

<p>This distinction matters in a homelab context because it changes what you build and why. If you’re running MISP to ingest abuse.ch feeds and call it “threat intel,” you’ve built a fancy blocklist manager. Which is fine — but it’s not intelligence work. Intelligence starts when you start asking <em>why</em> and <em>so what</em>.</p>

<p>Let’s build that understanding from the ground up.</p>

<hr />

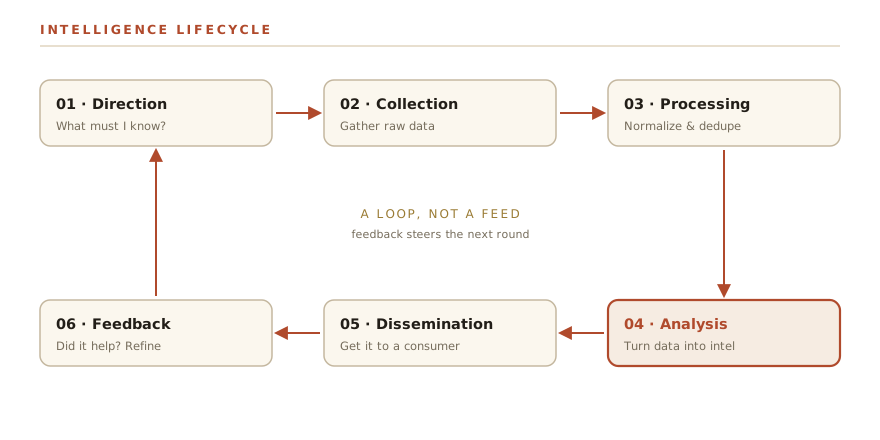
<figure class="diagram">
  <img src="/assets/diagrams/blue-team/ti-lifecycle.svg" alt="The threat-intelligence lifecycle as a six-stage wheel: direction, collection, processing, analysis and production, dissemination, and feedback looping back to direction." />
  <figcaption>The intelligence lifecycle — a loop, not a feed. Feedback steers the next round of collection.</figcaption>
</figure>

<hr />

<h2 id="the-intelligence-lifecycle">The Intelligence Lifecycle</h2>

<p>The intelligence lifecycle is a six-phase loop. Every professional CTI program runs on it, whether or not they’ve named it that. At home you’re running a stripped-down version of the same thing.</p>

<p><strong>Direction.</strong> Before you collect anything, you need to know what question you’re trying to answer. This is called the Priority Intelligence Requirement, or PIR, in formal programs. In homelab terms it sounds like: “I run self-hosted services on the internet. What threats are realistically targeting things like me?” That’s a PIR. It scopes everything downstream. Without it, you’re just downloading lists of malicious IPs and hoping.</p>

<p><strong>Collection.</strong> Given your direction, you gather raw data from sources that might contain relevant information. Threat reports, feeds, open-source repositories, honeypot data, your own logs. Collection without direction produces data lakes. Collection against a specific question produces useful signal.</p>

<p><strong>Processing.</strong> Raw data isn’t analysis-ready. You need to normalize formats (STIX/TAXII is a common standard, more on that in a moment), deduplicate, filter out things outside your scope, and structure it so a human — or a tool — can reason over it. This is often the least glamorous step and frequently the bottleneck. A lot of so-called “threat intel platforms” are really processing engines.</p>

<p><strong>Analysis and Production.</strong> This is the actual intelligence work. You look at what you’ve collected and processed, find patterns, connect dots, and produce something a decision-maker can act on. “These indicators are associated with a phishing campaign targeting financial services orgs using this particular lure” is analysis. A list of 40,000 IPs is not.</p>

<p><strong>Dissemination.</strong> Getting the product to whoever needs it. In a homelab this might be: updating your firewall rules, writing a hunt hypothesis to run in your SIEM, adding detection logic, or just noting in your notes file that a particular technique is active right now. The form follows the consumer.</p>

<p><strong>Feedback.</strong> The loop closes here. Your consumers — which at home is mostly you — tell you what was useful, what wasn’t, and what questions remain unanswered. That feedback reshapes your next Direction cycle. This is the phase most people skip, and it’s why bad intel programs keep collecting things no one uses.</p>

<hr />

<h2 id="strategic-operational-tactical">Strategic, Operational, Tactical</h2>

<p>Not all intelligence serves the same purpose. The field divides it into three levels, and they’re consumed by different people for different reasons.</p>

<p><strong>Strategic</strong> intelligence deals with long-term trends, geopolitics, and the “who and why” behind threats. Who are the major threat actors targeting this sector? What’s driving their motivation? What techniques are becoming more common over a multi-year timeframe? This level is consumed by executives and decision-makers. At home you’re engaging with strategic intel when you read a year-in-review threat landscape report and use it to decide whether to invest time hardening a particular service.</p>

<p><strong>Operational</strong> intelligence sits in the middle. It describes active campaigns: how a specific adversary is operating right now, what infrastructure they’re using, what TTPs define their current activity. It answers “how are they doing it?” for a particular campaign. Analysts and threat hunters consume this level — it’s how you design hunts and detections that are relevant to what’s actually happening, not just theoretically possible.</p>

<p><strong>Tactical</strong> intelligence is the atomic layer: indicators of compromise. Hashes, IP addresses, domains, file names, registry keys. Highly specific, highly actionable for automated systems, and highly perishable. An IP address that’s malicious today is often abandoned by next week. Your firewall and endpoint tools consume tactical intel.</p>

<p>The three levels form a pyramid in terms of durability. Tactical is the bottom — wide, abundant, and short-lived. Strategic is the apex — narrow, harder to produce, and it stays relevant for years.</p>

<hr />

<h2 id="iocs-vs-ttps--and-why-it-matters">IOCs vs TTPs — and Why It Matters</h2>

<p>This connects directly to what we covered in <a href="/02-threat-hunting/">Part 2</a> with the Pyramid of Pain. To recap: the Pyramid describes the cost an adversary pays when you detect and block at each level. Hash values at the bottom cost them nothing to change — one recompile. IP addresses, same story — spin up a new VPS. At the top of the pyramid are TTPs: the patterns of <em>how</em> they operate. Those are expensive to change because they’re baked into the adversary’s tooling, training, and habits.</p>

<p>The implication for intel work is the same: IOCs are perishable. A ThreatFox feed of malicious IPs is useful for blocking today’s infrastructure, but tomorrow that infrastructure may be gone and new IOCs will be different. A detection written against a TTP — say, PowerShell spawning from a parent process that shouldn’t spawn it — is durable. The adversary has to change their behavior, not just register a new domain.</p>

<p>This doesn’t mean IOC feeds are worthless. They block known-bad automatically and with low overhead. The mistake is treating them as intelligence rather than what they are: a low-level, high-volume, short-lived layer of defence.</p>

<p>If your intel work never rises above IOC collection, you’re defending against yesterday’s artifacts. The higher-value work is understanding the <em>techniques</em> in play and building detections that catch those techniques regardless of what infrastructure or tools the adversary uses.</p>

<hr />

<h2 id="the-diamond-model">The Diamond Model</h2>

<p>When you’re analyzing a specific intrusion or campaign, the Diamond Model of Intrusion Analysis is a structured way to reason about what you know and what you can infer.</p>

<p>The model has four vertices:</p>

<p><strong>Adversary</strong> — the threat actor. Who is conducting the activity? Their intent, motivation, and identity.</p>

<p><strong>Capability</strong> — the tools, techniques, and malware they use. What they can do.</p>

<p><strong>Infrastructure</strong> — the technical resources they use to operate: domains, IPs, C2 servers, email accounts. The “how they communicate with their tools” layer.</p>

<p><strong>Victim</strong> — the target. Who is being attacked and what features make them a target.</p>

<p>The insight is that these vertices are connected — you can pivot from any one to learn about the others. You observe a piece of infrastructure (a C2 domain) and pivot to: what other domains use the same registrar and registration pattern? That might expand your infrastructure picture. You see a capability (a particular malware family) and pivot to: what adversaries are known to use this? That connects to the adversary vertex.</p>

<p>In practice, most homelab analysts are working from the infrastructure and capability vertices — those are what show up in open-source feeds. The Diamond Model gives you a mental scaffold for asking “what else can I learn from this?” rather than just adding an IOC to a list and moving on.</p>

<hr />

<h2 id="mitre-attck-as-the-shared-language">MITRE ATT&amp;CK as the Shared Language</h2>

<p>ATT&amp;CK is the framework that connects intel work to detection engineering, which is Part 4. At its core it’s a structured catalog of adversary TTPs — organized by tactic (the goal: initial access, execution, persistence, etc.) and technique (the specific method: spearphishing attachment, PowerShell, scheduled task, etc.).</p>

<p>Its value in an intel context is that it gives you a common vocabulary. When a threat report says an adversary uses “T1059.001 — Command and Scripting Interpreter: PowerShell,” that’s a precise, standardized claim that you can immediately map to a detection engineering question: “Do I have coverage for that technique?” If you’re consuming intel from multiple sources in different formats, ATT&amp;CK IDs give you a way to normalize and compare across them.</p>

<p>The practical workflow: when you read a threat report or process a feed that includes technique information, map it to ATT&amp;CK. That mapping becomes the bridge to Part 4 — it turns intel into a detection requirement. “This campaign uses T1566.001 (spearphishing with an attachment) for initial access and T1059.001 (PowerShell) for execution” tells you exactly what techniques to build coverage for.</p>

<hr />

<h2 id="free-sources-worth-your-time">Free Sources Worth Your Time</h2>

<p>You don’t need paid subscriptions to do meaningful intel work at home. These sources are realistic for a homelab.</p>

<table>
  <thead>
    <tr>
      <th>Source</th>
      <th>What it gives you</th>
      <th>Level</th>
    </tr>
  </thead>
  <tbody>
    <tr>
      <td><a href="https://abuse.ch/">abuse.ch</a> (URLhaus / Feodo Tracker / ThreatFox)</td>
      <td>Active malware URLs, C2 IPs, IOC submissions from the community</td>
      <td>Tactical</td>
    </tr>
    <tr>
      <td><a href="https://otx.alienvault.com/">AlienVault OTX</a></td>
      <td>Community-curated threat pulses with IOCs + context, some ATT&amp;CK mapping</td>
      <td>Tactical / Operational</td>
    </tr>
    <tr>
      <td><a href="https://www.cisa.gov/known-exploited-vulnerabilities-catalog">CISA KEV Catalog</a></td>
      <td>Known exploited vulnerabilities — authoritative, updated frequently</td>
      <td>Operational</td>
    </tr>
    <tr>
      <td><a href="https://attack.mitre.org/">MITRE ATT&amp;CK</a></td>
      <td>The technique library; adversary group profiles; detection guidance</td>
      <td>Operational / Strategic</td>
    </tr>
    <tr>
      <td>Vendor threat reports (Mandiant, CrowdStrike, Microsoft)</td>
      <td>Annual/quarterly landscape analysis, named campaigns, TTP breakdowns</td>
      <td>Strategic / Operational</td>
    </tr>
  </tbody>
</table>

<p>A note on vendor reports: they exist partly for marketing. The Mandiant M-Trends report is genuinely useful; the accompanying press release is less so. Read the primary report, not the summary blog post. The data on dwell time, initial access vectors, and industry targeting distributions is valuable and grounded in real incident response cases.</p>

<hr />

<h2 id="tools-misp-and-opencti">Tools: MISP and OpenCTI</h2>

<p>Two open-source platforms dominate the homelab intel space.</p>

<p><strong>MISP</strong> (Malware Information Sharing Platform) is a mature, battle-tested platform for managing IOCs and sharing them across organizations. At home you’d use it to ingest feeds from abuse.ch, OTX, and others; tag and correlate events; and export IOCs to your firewall or SIEM. The MISP community runs sharing communities (called “MISP communities”) where orgs exchange intel — some are publicly joinable.</p>

<p>The honest assessment: MISP is powerful and comprehensive. It’s also complex to operate, with a lot of surface area for configuration. The learning curve is real. If your goal is structured IOC management and you’re willing to invest time, it pays off. If you just want to block feeds, a simpler option exists (your firewall can pull threat feeds directly).</p>

<p><strong>OpenCTI</strong> is a newer platform built around a STIX2 knowledge graph. Where MISP is strong on IOC management and sharing, OpenCTI is stronger on the knowledge graph side — it’s designed to represent relationships between entities: “this adversary used this malware, which connects to this campaign, which targeted this sector.” It integrates natively with MITRE ATT&amp;CK. It’s also heavier to run — it uses Elasticsearch and several dependent services and wants several gigabytes of RAM.</p>

<p>Neither is a weekend setup. Both have Docker Compose deployments that simplify the initial install, but plan for a week of configuration, connector setup, and getting feeds flowing before anything feels solid. The payoff is a platform that actually does intelligence work rather than just blocklist management — but be honest with yourself about whether you have the time to operate it properly.</p>

<hr />

<h2 id="a-worked-example-feed-to-hunt-to-detection">A Worked Example: Feed to Hunt to Detection</h2>

<p>This is the loop that makes intel useful rather than decorative.</p>

<p>Start on <a href="https://threatfox.abuse.ch/">ThreatFox</a>. Pull a recent submission — let’s say it’s a Cobalt Strike C2 domain with associated IP and a <code class="language-plaintext highlighter-rouge">BEACON</code> tag. The submitter has also provided a JA3 hash for the TLS fingerprint.</p>

<p><strong>Process:</strong> You have three IOCs (domain, IP, JA3 hash) and a malware family (Cobalt Strike Beacon). You map what you know: Cobalt Strike is a commercial pen-test tool heavily abused by ransomware operators and espionage groups. You look up Cobalt Strike in ATT&amp;CK — it maps across multiple techniques, but the relevant ones for Beacon are T1071.001 (Application Layer Protocol: Web Protocols, for C2 over HTTP/S) and T1095 (Non-Application Layer Protocol, for DNS beaconing).</p>

<p><strong>Enrich:</strong> OTX may have a pulse on this indicator with additional context — what campaign, what targeting. The CISA KEV catalog may have related vulnerabilities if this Beacon deployment is associated with known exploitation activity.</p>

<p><strong>Decide — hunt hypothesis or detection:</strong></p>

<p><em>Hunt hypothesis route (loops to <a href="/02-threat-hunting/">Part 2</a>):</em> “Do I have any traffic to this domain or IP in my logs from the past 30 days? Do I have any TLS connections matching this JA3 signature? Are there hosts on my network making high-frequency, low-payload HTTP connections consistent with Beacon’s beacon interval?” You run those queries in your log data.</p>

<p><em>Detection route (sets up Part 4):</em> The JA3 hash and the behavioral pattern of Beacon — periodic callback intervals, relatively uniform payload sizes — can be turned into detection rules. The domain and IP can be added to blocklists with a note about why. More durably: if you know Beacon typically uses named-pipe communication for lateral movement, that’s a behavioral detection that survives this specific campaign moving to new infrastructure.</p>

<p>This is the handoff. Intel produces a hypothesis or a detection requirement. It doesn’t sit in a list. It becomes work.</p>

<hr />

<div class="callout">
  <p><strong>Intel with no consumer is a hobby.</strong></p>

  <p>Every piece of intelligence you produce should connect to one of three things: a hunt you’re going to run, a detection you’re going to build, or a decision you’re going to make. “We’re going to add memory to the watchlist and monitor for this technique for the next 30 days” is a decision. “Added to MISP” is filing. Filing is not intelligence work.</p>

  <p>Before you ingest a new source, ask: what will I do differently because of information from this source? If you can’t answer that, the source is probably overhead you don’t need.</p>
</div>

<hr />

<div class="sidebar-note">
  <p><strong>How I run mine.</strong></p>

  <p>I keep it lightweight by design. I pull the ThreatFox daily export and the CISA KEV catalog into a small script that normalizes both into a common format and checks for overlap with services I’m actually running. New KEVs relevant to my stack generate a note in my log file with the CVE and the affected version. I review it weekly, not in real time — real-time alerting on a feed this size generates fatigue fast.</p>

  <p>For richer analysis I use OTX occasionally — when something interesting shows up in my own logs and I want context. ATT&amp;CK is always open in a browser tab when I’m building detections; the technique IDs are the thread that connects “I heard this is happening” to “here’s what I’m looking for.”</p>

  <p>I don’t run MISP or OpenCTI locally. The operational overhead for a single-analyst homelab isn’t worth it relative to what I’d get. If I were sharing intel with other operators or running a production environment, I’d reconsider. The platform matters less than the process — you can run the entire lifecycle with scripts, a notes file, and browser tabs if you’re disciplined about it.</p>
</div>

<hr />

<h2 id="what-youre-actually-building-toward">What You’re Actually Building Toward</h2>

<p>Intelligence without detection is academic. Detection without intelligence is blind. Part 4 is where these two disciplines connect properly: we’ll take the ATT&amp;CK techniques that intel work surfaces and turn them into actual detection rules — Sigma, log queries, behavioral signatures — that run against real data.</p>

<p>The work you do here — mapping IOCs to techniques, understanding adversary behaviour at the TTP level, building the habit of asking “what does this mean for what I should detect” — is the foundation that makes Part 4 useful rather than a recipe you’re copying without understanding.</p>

<h2 id="next-up">Next Up</h2>

<p><a href="/04-detection-engineering/">Detection Engineering: From Intel to Rules</a> — taking what you’ve learned about adversary behaviour and turning it into detections that actually run.</p>

<hr />

<p><em>Previous: <a href="/02-threat-hunting/">Threat hunting: hypotheses, not alerts</a></em></p>]]></content><author><name>MrK</name></author><summary type="html"><![CDATA[Intelligence is a process, not a list of bad IPs. The intel lifecycle, strategic/operational/tactical levels, IOCs vs TTPs, and running MISP or OpenCTI at home.]]></summary></entry><entry><title type="html">Threat Hunting: Hypotheses, Not Alerts</title><link href="https://kc-explore.github.io/02-threat-hunting/" rel="alternate" type="text/html" title="Threat Hunting: Hypotheses, Not Alerts" /><published>2026-05-23T00:00:00+00:00</published><updated>2026-05-23T00:00:00+00:00</updated><id>https://kc-explore.github.io/02-threat-hunting</id><content type="html" xml:base="https://kc-explore.github.io/02-threat-hunting/"><![CDATA[<p>Most defenders spend their time reacting. An alert fires, they investigate, they close it. That loop is useful but it has a blind spot the size of a truck: it only catches what your detections are already looking for.</p>

<p>Threat hunting is the discipline of going looking before the alert fires. You assume something slipped through — because statistically, something always has — and you go look for evidence of it in your own telemetry. No alert required. You start with a hypothesis and go see if the data agrees.</p>

<p>That framing matters a lot. Threat hunting is not “running your SIEM harder.” It is not reviewing old alerts. It is proactive, hypothesis-driven search for threats that your existing detections missed. The moment you understand that distinction, the rest of this post makes sense.</p>

<hr />

<figure class="diagram">
  <img src="/assets/diagrams/blue-team/peak-hunt-loop.svg" alt="The PEAK threat-hunting loop — Prepare, Execute, and Act with Knowledge — beside the Pyramid of Pain showing indicators from easy-to-change hashes up to hard-to-change TTPs." />
  <figcaption>The PEAK hunt loop and the Pyramid of Pain — hunt up the pyramid, toward an adversary's behaviour.</figcaption>
</figure>

<hr />

<h2 id="why-bother-hunting-at-home">Why bother hunting at home?</h2>

<p>Fair question. You’re one person, running a homelab, protecting data that is probably not the target of an APT. The realistic threat model is automated botnets, opportunistic credential-stuffers, and the occasional cryptominer looking for an open door.</p>

<p>Here’s why hunting still makes sense:</p>

<p>First, it is the best hands-on education in this field. Reading about adversary behaviour is fine. Hunting through your own telemetry to look for it is a different category of learning entirely. The techniques are the same ones you’d use in a corporate SOC — the stakes are lower, which means you can experiment freely.</p>

<p>Second, every hunt you run produces one of two outputs: an incident you can investigate, or a new detection rule you can add to your monitoring stack. Even a hunt that finds nothing should produce a tested negative and a new detection idea. You’re feeding your detection engineering pipeline from post 04 of this series, whether you find something or not.</p>

<p>Third, if you’re building blue team skills for a career, “I hunt in my homelab” is a more credible answer than “I read about hunting” — and you’ll be able to talk concretely about what you found and what you built afterward.</p>

<hr />

<h2 id="the-peak-framework">The PEAK framework</h2>

<p>PEAK was developed by the team at Splunk SURGe as a structured methodology for threat hunting. The name is an acronym for the three stages: <strong>Prepare</strong>, <strong>Execute</strong>, and <strong>Act with Knowledge</strong>. It gives you a repeatable loop rather than an ad hoc “I guess I’ll look at some logs” session.</p>

<h3 id="prepare">Prepare</h3>

<p>This is the upfront work that determines whether your hunt produces anything useful. In this stage you:</p>

<ul>
  <li><strong>Choose a hypothesis.</strong> A specific, falsifiable statement about adversary behaviour. Not “let me look for bad things” — that is not a hypothesis. Something like: “if an attacker used scheduled tasks for persistence, I’d expect to see new entries created around the time my telemetry shows unusual activity.”</li>
  <li><strong>Scope the hunt.</strong> What time range? Which hosts? Which data sources? Narrowing scope keeps the hunt manageable and the results interpretable.</li>
  <li><strong>Identify your data sources.</strong> Do you have the logs to test this hypothesis? If the answer is no, the Prepare stage has already been useful — you’ve identified a visibility gap.</li>
</ul>

<p>The best hypotheses come from threat intelligence (what are real actors doing right now?) or from the MITRE ATT&amp;CK framework (what techniques are used for this tactic, and do I have coverage?). More on ATT&amp;CK in a moment.</p>

<h3 id="execute">Execute</h3>

<p>You go get the data and analyze it. In this stage you:</p>

<ul>
  <li><strong>Gather and query the telemetry.</strong> Run the queries against your SIEM, log aggregator, or raw log files. Look for the artifact your hypothesis predicts.</li>
  <li><strong>Analyze and pivot.</strong> If something looks interesting, pivot on it — look at the host in question across other data sources, expand the time window, chase related events.</li>
  <li><strong>Keep notes.</strong> Every query you ran, every result that looked interesting or definitively normal, every dead end. This documentation is the output of the hunt whether you find something or not.</li>
</ul>

<p>The goal in this stage is rigorous analysis, not confirmation bias. You are trying to falsify your hypothesis as much as confirm it.</p>

<h3 id="act-with-knowledge">Act with Knowledge</h3>

<p>This stage is where the value gets captured and retained. In this stage you:</p>

<ul>
  <li><strong>Document findings.</strong> Positive or negative. What did you look for, what did you find, what did it mean?</li>
  <li><strong>Create detections.</strong> If you found something, build a detection rule so you don’t have to hunt for it manually next time. If you found nothing but the hunt was valid, build the detection anyway — you’ve just proven the query works and can be automated.</li>
  <li><strong>Hand off if needed.</strong> In a team context this means escalating to incident response or detection engineering. In a homelab context it means updating your monitoring stack and your runbook.</li>
  <li><strong>Update your process.</strong> What data source did you wish you had? What hypothesis would you test next? The end of one hunt is the input to the next Prepare stage.</li>
</ul>

<p>PEAK also defines three types of hunt you can execute within this loop:</p>

<ul>
  <li><strong>Hypothesis-driven hunts</strong> — start from a specific technique or behaviour you expect to find evidence of. Most structured hunts are this type.</li>
  <li><strong>Baseline/exploratory hunts</strong> — look for deviations from what’s normal in your environment, without a specific hypothesis. Useful for discovering anomalies you didn’t know to look for.</li>
  <li><strong>Model-assisted hunts (M-ATH)</strong> — use statistical or machine learning models to surface outliers for human analysis. This is the most sophisticated type, and in a homelab context it’s probably out of scope until you have strong baseline coverage first.</li>
</ul>

<hr />

<h2 id="the-pyramid-of-pain">The Pyramid of Pain</h2>

<p>David J. Bianco’s Pyramid of Pain frames threat indicators by how much it hurts an adversary when you detect and block them. It runs from the bottom — trivially easy for attackers to change — to the top, where evading detection requires re-engineering their entire operation.</p>

<p>The pyramid, bottom to top:</p>

<table>
  <thead>
    <tr>
      <th>Level</th>
      <th>Indicator Type</th>
      <th>Pain to Adversary</th>
    </tr>
  </thead>
  <tbody>
    <tr>
      <td>1</td>
      <td>Hash values</td>
      <td>Trivial — recompile or re-pack, hash changes instantly</td>
    </tr>
    <tr>
      <td>2</td>
      <td>IP addresses</td>
      <td>Easy — rotate C2 infrastructure, get a new VPS</td>
    </tr>
    <tr>
      <td>3</td>
      <td>Domain names</td>
      <td>Annoying — register a new domain, update DNS, cost some money</td>
    </tr>
    <tr>
      <td>4</td>
      <td>Network/Host artifacts</td>
      <td>Significant — specific strings, registry keys, file paths that tools leave behind</td>
    </tr>
    <tr>
      <td>5</td>
      <td>Tools</td>
      <td>Major — adversary has to find or build different tooling</td>
    </tr>
    <tr>
      <td>6</td>
      <td>TTPs (Tactics, Techniques, Procedures)</td>
      <td>Maximum — changing TTPs means changing how the adversary operates</td>
    </tr>
  </tbody>
</table>

<p>Most security tooling lives at the bottom of the pyramid. Hashes and IPs populate threat intel feeds. Blocking them is cheap for you to do and cheap for attackers to evade. You block a C2 IP, the attacker rotates to a new one in ten minutes.</p>

<p>The goal of threat hunting is to find indicators as high up the pyramid as you can. TTPs are behaviours — the way an adversary moves laterally, establishes persistence, exfiltrates data. These are harder to change because they reflect how the attacker <em>thinks</em> about compromising systems. If you can detect the behaviour rather than the specific tool or IP address, you’ve raised the cost of evading your detection enormously.</p>

<p>This is exactly where MITRE ATT&amp;CK becomes useful.</p>

<hr />

<h2 id="mitre-attck-as-the-hunt-map">MITRE ATT&amp;CK as the hunt map</h2>

<p>ATT&amp;CK is a knowledge base of adversary tactics, techniques, and sub-techniques observed in real-world attacks. Think of it as a catalogue: for each thing an attacker might do — initial access, persistence, defense evasion, exfiltration — ATT&amp;CK documents what it looks like, what data sources can detect it, and what mitigations exist.</p>

<p>For threat hunting, ATT&amp;CK gives you a structured way to pick your next hypothesis. Instead of “I should look for suspicious things,” you can say “I haven’t tested my coverage of T1053 — Scheduled Task/Job. Let me build a hypothesis and hunt for it.”</p>

<p>A useful hypothesis format:</p>

<blockquote>
  <p>If [technique] happened in my environment, I would expect to see [specific artifact] in [specific data source], with [these characteristics].</p>
</blockquote>

<p>That structure — if X happened, then Y would be observable — is what makes a hypothesis falsifiable. If you go look for Y and don’t find it, you’ve either confirmed X didn’t happen, or you’ve found a gap in your telemetry. Either outcome is useful.</p>

<hr />

<h2 id="data-sources-you-need-at-home">Data sources you need at home</h2>

<p>You can’t hunt what you can’t see. The minimum viable telemetry stack for a homelab hunt program:</p>

<p><strong>Sysmon (Windows)</strong> — the Microsoft System Monitor installs as a driver and logs process creation, network connections, file system events, registry changes, and more with far more detail than Windows’ built-in event logging. Event ID 1 (process creation) and Event ID 3 (network connection) alone cover a large fraction of common hunting scenarios. If you run any Windows hosts in your lab, Sysmon is non-negotiable.</p>

<p><strong>auditd + osquery (Linux)</strong> — auditd captures syscall-level activity on Linux hosts; osquery lets you query the OS state (running processes, network connections, loaded kernel modules) using SQL. Together they give you real-time and historical visibility into what’s happening on your Linux machines.</p>

<p><strong>Zeek (network metadata)</strong> — Zeek sits on a network TAP or span port and generates structured logs: connection records, DNS queries, HTTP requests, SSL certificate metadata, and more. It does not capture full packet payloads (no PCAP bloat) — it produces analyst-friendly metadata. Even in a home network, Zeek on a Pi or small VM seeing your LAN traffic tells you things your endpoint logs cannot.</p>

<hr />

<h2 id="a-worked-hunt-beaconing-via-suspicious-scheduled-tasks">A worked hunt: beaconing via suspicious scheduled tasks</h2>

<p>Let’s walk through a complete hunt end to end using the PEAK loop.</p>

<p><strong>Hypothesis (Prepare):</strong></p>

<blockquote>
  <p>If an attacker established persistence using a scheduled task (T1053.005 — Scheduled Task), I would expect to see Sysmon Event ID 1 (process creation) for <code class="language-plaintext highlighter-rouge">schtasks.exe</code> or <code class="language-plaintext highlighter-rouge">at.exe</code> with command-line arguments that create a new task, at a time or from a parent process that does not match my normal admin activity. I would also expect to see a corresponding Windows Task Scheduler event (Event ID 4698) in the Security log.</p>
</blockquote>

<p><strong>Data sources identified:</strong> Sysmon Event ID 1, Windows Security Event ID 4698.</p>

<p><strong>Scope:</strong> All Windows hosts in the lab, last 30 days.</p>

<p><strong>Execute — the query:</strong></p>

<p>In a home setup you might be shipping logs to Elasticsearch, a Graylog instance, or even reading raw Sysmon <code class="language-plaintext highlighter-rouge">.evtx</code> files. Here is the logic in pseudo-SPL (Splunk-style) with comments that translate to any log query tool:</p>

<pre><code class="language-spl">index=sysmon EventID=1                     # Process creation events only
  (Image="*\\schtasks.exe"                 # Direct schtasks invocation
   OR Image="*\\at.exe")                   # Legacy at.exe — rare but present in old TTPs
  CommandLine="*/create*"                  # Only care about task creation, not query/delete
| eval parent_suspicious=if(
    match(ParentImage, "(?i)(cmd\.exe|powershell\.exe|wscript\.exe|cscript\.exe)"),
    1, 0)                                  # Flag if parent is a shell or scripting host
| where parent_suspicious=1               # Drop routine admin activity (Task Scheduler service, etc.)
| table _time, ComputerName, User, CommandLine, ParentImage, ParentCommandLine
| sort -_time
</code></pre>

<p>Pair that with:</p>

<pre><code class="language-spl">index=wineventlog source="WinEventLog:Security" EventCode=4698
# Event 4698 = "A scheduled task was created"
# Contains the task XML: shows trigger, action, author, run-as account
| table _time, ComputerName, TaskName, TaskContent, SubjectUserName
| sort -_time
</code></pre>

<p><strong>Interpret the results:</strong></p>

<p>If both queries return nothing: strong negative — no scheduled tasks were created from suspicious parent processes in this window. Document it and move on.</p>

<p>If Sysmon Event ID 1 shows <code class="language-plaintext highlighter-rouge">powershell.exe</code> spawning <code class="language-plaintext highlighter-rouge">schtasks.exe /create /sc minute /mo 5 /tn "WindowsUpdate" /tr "C:\Users\Public\update.ps1"</code> — that is a very loud indicator. Short interval, generic task name designed to blend in, script living in a user-writable path. Investigate that host immediately.</p>

<p>If you find legitimate admin activity that triggered the rule: tune the query to exclude your known-good paths and users, and document the exclusion. You’ve just made the detection more accurate.</p>

<p><strong>Outcome and promotion:</strong></p>

<p>If the hunt finds nothing suspicious, take the query logic and turn it into a persistent alert in your SIEM or log platform. You’ve validated that the query runs correctly and produces no false positives in your environment. Now it’s automated — you don’t need to run this hunt manually again unless your environment changes.</p>

<p>If it finds something: you have an incident. Work the incident, then build the detection once you understand the full scope of what happened.</p>

<p>That is the loop. Hunt → find or not-find → build detection → run next hunt.</p>

<hr />

<h2 id="the-peak-loop-as-a-diagram">The PEAK loop as a diagram</h2>

<pre><code class="language-mermaid">flowchart TD
  A[Hypothesis: technique X leaves artifact Y] --&gt; B[Identify data sources]
  B --&gt; C[Gather + query telemetry]
  C --&gt; D{Evidence of Y?}
  D --&gt;|Yes| E[Scope + investigate]
  E --&gt; F[Respond + document]
  F --&gt; G[Write a durable detection]
  D --&gt;|No| H[Document the negative result]
  H --&gt; I[Refine or retire hypothesis]
  G --&gt; J[Hand to Detection Engineering]
</code></pre>

<hr />

<div class="callout">
  <p><strong>A hunt that finds nothing still wins.</strong></p>

  <p>The instinct is to measure a hunt’s success by whether you found an attacker. That’s the wrong metric. A hunt that produces a tested negative — “I looked for T1053 evidence across 30 days of logs and found nothing suspicious” — has three real outputs: you confirmed your telemetry covers this technique, you validated the query works correctly in your environment, and you have a detection rule ready to deploy. None of that requires finding an actual incident. The moment you let “finding nothing means wasted time” creep in, you’ll start chasing false positives to justify the work. Resist that. Document the negative, deploy the detection, move to the next hypothesis.</p>
</div>

<hr />

<div class="sidebar-note">
  <p><strong>How I run hunts in mine.</strong></p>

  <p>I pick techniques from ATT&amp;CK that I haven’t covered yet in my detection stack and work through them one at a time. Before I run a hunt I write down the hypothesis in plain English, identify which logs I’d need to test it, and confirm I’m actually collecting those logs before I start querying. I keep a plain text hunt log — date, technique, hypothesis, queries I ran, what I found, what detection came out of it. That file has become one of the more useful things in my homelab. When I’m tuning a detection later, I can go back and see exactly what the data looked like when I built it.</p>
</div>

<hr />

<h2 id="hunting-up-the-pyramid">Hunting up the Pyramid</h2>

<p>One practical note on prioritizing your hunts: start at the bottom of the Pyramid of Pain and work up, but <em>aim</em> for the top.</p>

<p>Starting low (hashes, IPs) is easy and gives you quick wins, but those detections are fragile — an attacker can evade them trivially. Over time, push your hunts toward artifacts and TTPs. A hunt for “PowerShell spawned from a document viewer” is harder to build and tune than a hash blocklist, but it catches a whole class of attacks regardless of what specific payload was used. That’s the goal: detection rules that are robust against evasion because they target behaviour, not indicators.</p>

<p>ATT&amp;CK maps every technique to observable artifacts in specific data sources. Use that mapping to work through your stack systematically. Sub-technique T1059.001 (PowerShell) → data source: Process creation, Command execution → look for Sysmon Event ID 1 with <code class="language-plaintext highlighter-rouge">powershell.exe</code> and suspicious command-line flags. T1078 (Valid Accounts) → Logon events → look for authentication from unusual source IPs or at unusual hours. Each hunt tells you something about your visibility and adds a layer to your detection coverage.</p>

<hr />

<h2 id="quick-reference-hunt-planning-checklist">Quick reference: hunt planning checklist</h2>

<table>
  <thead>
    <tr>
      <th>Step</th>
      <th>Question to answer</th>
    </tr>
  </thead>
  <tbody>
    <tr>
      <td>Hypothesis</td>
      <td>What technique am I testing? Is this falsifiable?</td>
    </tr>
    <tr>
      <td>ATT&amp;CK mapping</td>
      <td>What’s the technique ID? What data sources does ATT&amp;CK recommend?</td>
    </tr>
    <tr>
      <td>Data availability</td>
      <td>Do I actually collect those logs? If not, gap identified — stop here</td>
    </tr>
    <tr>
      <td>Scope</td>
      <td>Which hosts? What time range?</td>
    </tr>
    <tr>
      <td>Query</td>
      <td>What query logic tests the hypothesis?</td>
    </tr>
    <tr>
      <td>Baseline</td>
      <td>What does normal look like? What should I exclude?</td>
    </tr>
    <tr>
      <td>Output</td>
      <td>What detection rule does this hunt produce?</td>
    </tr>
    <tr>
      <td>Documentation</td>
      <td>Where does this go in my hunt log?</td>
    </tr>
  </tbody>
</table>

<hr />

<h2 id="next-up">Next Up</h2>

<p>Post 03 covers threat intelligence at home — how to consume, filter, and operationalize external threat intel without drowning in noise: <a href="/03-threat-intel/">Threat Intelligence: Signal vs. Noise at Home</a>.</p>

<hr />

<p><em>Previous: <a href="/01-soc-architecture/">Building a home SOC: the architecture</a></em></p>]]></content><author><name>MrK</name></author><summary type="html"><![CDATA[Hunting is what you do when nothing alerted. The PEAK loop, the Pyramid of Pain, and using MITRE ATT&CK to turn a hunch into a repeatable hunt.]]></summary></entry><entry><title type="html">Building a Home SOC: The Architecture</title><link href="https://kc-explore.github.io/01-soc-architecture/" rel="alternate" type="text/html" title="Building a Home SOC: The Architecture" /><published>2026-05-16T00:00:00+00:00</published><updated>2026-05-16T00:00:00+00:00</updated><id>https://kc-explore.github.io/01-soc-architecture</id><content type="html" xml:base="https://kc-explore.github.io/01-soc-architecture/"><![CDATA[<p>Most people who want to “run a SOC at home” start by downloading a tool. That’s backwards. Before you pick a stack, you need a mental model — because every tool decision you make either fits the pipeline or fights it, and if you don’t know the pipeline, you can’t tell the difference.</p>

<p>This post is that mental model. By the end you’ll know what a SOC is actually doing, what you need to collect, how the collection layer works, which SIEM is worth your time at home, and how to think about retention without starving your machine. Then we’ll get concrete.</p>

<hr />

<figure class="diagram">
  <img src="/assets/diagrams/blue-team/soc-architecture.svg" alt="A home SOC data pipeline: log sources feed collection agents, which normalize and ship events into a SIEM that runs detections, raises alerts, and powers dashboards for triage." />
  <figcaption>The SOC data pipeline — sources to collection to SIEM to detection, alerting, and triage.</figcaption>
</figure>

<hr />

<h2 id="the-one-mental-model-you-need">The One Mental Model You Need</h2>

<p>A SOC — Security Operations Center, corporate or homelab — is a single pipeline with six stages. Everything in this series maps to one of them:</p>

<p><strong>Sources → Collection/Shipping → Parse/Normalize → Store/Index (SIEM) → Detect → Alert → Triage → Dashboards</strong></p>

<p>That’s it. Strip away the vendor marketing, the product names, the conference theatre, and you have a pipeline that moves events from wherever they happened to a place where you can act on them. Each stage has exactly one job:</p>

<ul>
  <li><strong>Sources</strong> generate events: your Linux host, your firewall, your DNS server, your web server.</li>
  <li><strong>Collection agents</strong> run on or near the source, read those events, and ship them somewhere central.</li>
  <li><strong>Parsing and normalization</strong> translate “sshd[1234]: Failed password for root from 10.0.0.1 port 51234 ssh2” into a structured record with consistent field names — source IP, destination IP, event type, timestamp — so that detection rules can be written once and applied everywhere.</li>
  <li><strong>The SIEM</strong> stores those normalized records and indexes them for fast search and correlation.</li>
  <li><strong>Detection rules</strong> run against the event stream and produce alerts when something matches a pattern you care about.</li>
  <li><strong>Alerting</strong> delivers those detections to you: a Telegram message, an email, a PagerDuty call if you’re running something enterprise-adjacent.</li>
  <li><strong>Triage and dashboards</strong> are where a human looks at what the pipeline surfaced and decides whether it’s real.</li>
</ul>

<p>Anchor everything on this. When someone tells you Wazuh is a SIEM, you now know enough to push back: it’s more accurately a HIDS with SIEM-adjacent capabilities that covers collection, normalization, and detection, with a dashboard that handles triage. When someone says Elastic is just a search engine, you can see that it’s the store/index layer that you wire the rest of the pipeline around. Names obscure. Stages clarify.</p>

<hr />

<h2 id="what-to-collect-at-home">What to Collect at Home</h2>

<p>The temptation is to collect everything. Resist it. You can only triage what you have time to look at, and a pipeline flooded with noise is worse than a narrower one you actually use. Collect what has signal. Add more when you’ve burned through the first layer.</p>

<p><strong>Host logs — Linux</strong></p>

<p>If you have Linux machines (and if you’re homelabbing, you do), start here. Two sources matter:</p>

<p><code class="language-plaintext highlighter-rouge">auditd</code> watches system calls and produces a structured event for every file access, privilege escalation, process exec, and network connection that matches your rules. It’s noisy out of the box — you’ll need a ruleset like <a href="https://github.com/Neo23x0/auditd">Florian Roth’s auditd rules</a> to get meaningful signal without drowning in routine I/O. The payoff: it catches things like a process writing to <code class="language-plaintext highlighter-rouge">/etc/passwd</code> or a reverse shell spawning a bash child — the kind of activity that shows up in breach reports.</p>

<p><code class="language-plaintext highlighter-rouge">journald</code> and <code class="language-plaintext highlighter-rouge">syslog</code> give you application logs, auth logs, and kernel messages. The most useful file is <code class="language-plaintext highlighter-rouge">/var/log/auth.log</code> (or <code class="language-plaintext highlighter-rouge">journalctl -u ssh</code> on systemd systems): every SSH login attempt, success, failure, and sudo invocation is there. Boring and essential.</p>

<p><strong>Host logs — Windows</strong></p>

<p>Windows Security Event Log is the primary source. The events that actually matter for detection: 4624 (successful logon), 4625 (failed logon), 4648 (logon with explicit credentials, common in pass-the-hash), 4688 (new process created — enable command-line logging), 4698/4702 (scheduled task created/modified), 7045 (new service installed). That’s your starter list; you don’t need all 1,000 event IDs.</p>

<p>Sysmon takes Windows logging from “adequate” to “genuinely useful.” It’s a Microsoft Sysinternals tool that runs as a driver and produces rich events for process creation, network connections, file creation, registry changes, and more — all with hashes and parent process info. The <a href="https://github.com/SwiftOnSecurity/sysmon-config">SwiftOnSecurity config</a> is the standard baseline. If you have any Windows machines in your lab, install Sysmon on them. The improvement in detection quality is significant.</p>

<p><strong>Network logs</strong></p>

<p>Network visibility is what catches the things that never touch your hosts — lateral movement, command-and-control, DNS exfiltration.</p>

<p>Zeek (formerly Bro) runs on a tap or span port and produces structured logs for every protocol it understands: HTTP, DNS, TLS (metadata, not decrypted content), SSH, SMB. A single Zeek log line for a DNS query tells you the querying host, the query name, the response, the query type, and the answer TTL. That’s enough to catch DNS tunneling and C2 beaconing by pattern.</p>

<p>Suricata does signature-based detection on network traffic — it’s the IDS/IPS layer. Point it at your network interface and load the Emerging Threats ruleset and it will flag known-bad patterns: malware traffic signatures, exploit kit callbacks, cryptocurrency mining, anomalous protocols. False positive rate is manageable if you tune the rules to your network; untouched, it will generate a lot of noise you have to work through.</p>

<p>If you have a firewall — pfSense, OPNsense, or even just UFW logs forwarded from your hosts — collect it. Firewall logs tell you what connections were allowed and denied, which is the coarsest possible network visibility but still useful for spotting unexpected outbound connections or port scanning.</p>

<p><strong>DNS — Pi-hole is a gift here</strong></p>

<p>If you’re running Pi-hole for ad blocking (and if you’re homelabbing, you probably are), you’re already sitting on a DNS log source that most small organizations would pay for. Every DNS query from every device on your network passes through it. Enable query logging, ship those logs into your pipeline, and you get:</p>

<ul>
  <li>A full record of every domain every device resolved</li>
  <li>Baseline normal DNS behavior per host (so anomalies stick out)</li>
  <li>Easy detection of devices talking to newly-registered domains, DGA patterns, or known-bad domains</li>
</ul>

<p>It’s almost comically underused as a security telemetry source. Collect it.</p>

<p><strong>Service logs</strong></p>

<p><code class="language-plaintext highlighter-rouge">nginx</code> access logs and error logs. SSH auth logs (already covered above). Any application logs your services produce. These are lower-priority than host and network, but they close the gap when you’re trying to reconstruct what happened to a specific service.</p>

<hr />

<h2 id="collection-and-shipping-agents">Collection and Shipping Agents</h2>

<p>You have log sources. You need something to read them and move the events somewhere central. This is the collection layer, and the three tools worth knowing for a homelab are:</p>

<p><strong>Wazuh agent</strong> — if you’re running Wazuh as your SIEM (more on this below), the Wazuh agent handles collection and ships to the Wazuh manager. It reads local log files, integrates with auditd, runs integrity checking, and handles a lot of the parsing. For a Wazuh-centric setup, you just deploy the agent and point it at the manager.</p>

<p><strong>Elastic Agent / Beats family</strong> — if you’re running the Elastic Stack, Filebeat is the standard log shipper: it tails log files and ships them to Elasticsearch or Logstash. Winlogbeat is the Windows-specific equivalent for Event Log. Elastic Agent is the unified replacement for the individual Beats — it does collection, parsing, and detection in a single binary. More config overhead upfront, but cleaner at scale.</p>

<p><strong>Fluent Bit</strong> — a lightweight, vendor-neutral log forwarder written in C. Lower resource footprint than the others, which matters when you’re running it as a sidecar on a machine that’s doing other things. Worth considering for resource-constrained hosts.</p>

<p><strong>On normalization and why it matters</strong></p>

<p>Raw log formats are a mess. sshd writes one thing, nginx writes another, Windows Event Log writes something completely different. Detection rules that operate on raw text are brittle — they break when a log format changes, and they can’t correlate across sources.</p>

<p>Normalization solves this by mapping everything to a common schema. The standard in the open-source world is <a href="https://www.elastic.co/guide/en/ecs/current/index.html">ECS — Elastic Common Schema</a>: consistent field names across event types (<code class="language-plaintext highlighter-rouge">source.ip</code>, <code class="language-plaintext highlighter-rouge">destination.port</code>, <code class="language-plaintext highlighter-rouge">process.name</code>, <code class="language-plaintext highlighter-rouge">event.outcome</code>). When your Linux auth log and your Windows Security log both normalize to ECS, you can write one detection rule that fires on failed authentication from any source. Without normalization, you write two rules, then six, then give up maintaining them.</p>

<p>The collection agent usually handles normalization before shipping. Wazuh has its own decoder/rule format. Elastic Agent includes ingest pipelines. The point is: don’t ship raw text if you can help it. Normalized events at rest mean faster detection rules and easier queries.</p>

<hr />

<h2 id="siem-choice-for-a-homelab">SIEM Choice for a Homelab</h2>

<p>This is where most guides either pick a vendor without justifying it or give you a list so long it’s useless. Here’s an honest comparison:</p>

<table>
  <thead>
    <tr>
      <th>Option</th>
      <th>What it is</th>
      <th>RAM / Effort</th>
      <th>Best for</th>
    </tr>
  </thead>
  <tbody>
    <tr>
      <td><strong>Security Onion</strong></td>
      <td>All-in-one distribution: Zeek + Suricata + Elastic + Kibana + TheHive, pre-integrated</td>
      <td>16 GB minimum, steep first-run curve</td>
      <td>Serious homelabbers who want everything pre-wired and are willing to trade flexibility for batteries-included</td>
    </tr>
    <tr>
      <td><strong>Wazuh</strong></td>
      <td>HIDS + SIEM hybrid: agent-based collection, detection rules, compliance dashboards, XDR capabilities</td>
      <td>4–8 GB workable, moderate setup</td>
      <td>Best starting point for most homelabs; good docs, active community, real detection out of the box</td>
    </tr>
    <tr>
      <td><strong>Elastic Stack</strong></td>
      <td>Elasticsearch + Kibana + Elastic Agent/Fleet; most flexible, most powerful querying</td>
      <td>8–16 GB practical minimum, high config overhead</td>
      <td>If you want full control over your pipeline and are willing to build detection rules yourself</td>
    </tr>
    <tr>
      <td><strong>Graylog + OpenSearch</strong></td>
      <td>Log management platform; excellent search and alerting, weaker on HIDS/endpoint</td>
      <td>6–8 GB workable, moderate setup</td>
      <td>Log-centric use cases where you want good search and alerting without committing to the Elastic ecosystem</td>
    </tr>
  </tbody>
</table>

<p><strong>My concrete recommendation for starting out: Wazuh.</strong></p>

<p>Here’s why. Security Onion is technically impressive but it’s a serious machine commitment and the setup complexity front-loads a lot of friction that gets in the way of actually learning detection. Elastic is fantastic but you’ll spend your first month configuring pipelines before you get a single useful alert. Graylog is strong but leans toward log management rather than security operations.</p>

<p>Wazuh hits the practical sweet spot: real HIDS capability out of the box, a detection rule library that covers common attack techniques, a web dashboard for triage, and enough documentation that you can troubleshoot when things go sideways. Once you’ve outgrown Wazuh — once you’re shipping network logs and want custom correlation rules and a graph-based threat hunt view — you’ll know exactly what you need and why. Start there.</p>

<hr />

<h2 id="t1t2t3-reframed-for-a-solo-homelabber">T1/T2/T3 Reframed for a Solo Homelabber</h2>

<p>In enterprise security, T1/T2/T3 refers to analyst tiers — different people with different skill levels handling different depths of investigation. In a homelab, you are all three tiers, and that’s actually fine. Reframe the tiers as workflow stages you rotate through:</p>

<p><strong>T1 — Triage:</strong> An alert fired. Is it real? Is it a known false positive? Is this something that can be closed in under two minutes? This is where you spend the most time. The goal is to close the noise as fast as possible so the signal can surface. Good detection rules and a well-tuned baseline cut T1 time dramatically — which is why normalization and rule quality matter more than alert volume.</p>

<p><strong>T2 — Investigate:</strong> Something passed T1 and looks real. Now you’re correlating: what else was happening on that host at that time? Was there network activity to match? What processes were running? This is where good logs pay off. If you only collected auth logs, you’re guessing. If you have auditd, Sysmon, and Zeek, you can reconstruct the timeline.</p>

<p><strong>T3 — Hunt and engineer:</strong> No alert fired, but you want to look for something specific. Or you found a gap in your detection coverage and want to write a rule for it. This is the proactive mode: threat hunting, detection engineering, building the playbooks that make T1 faster next time.</p>

<p>A healthy homelab SOC practice rotates through all three. Don’t just watch the alert feed — spend time at T3 even when nothing is firing.</p>

<hr />

<h2 id="storage-and-retention-reality">Storage and Retention Reality</h2>

<p>This is where homelab SOCs usually go wrong. You set up a SIEM, it starts ingesting logs, and three months later your disk is 90% full and Elasticsearch is refusing writes.</p>

<p>The practical framework: <strong>hot vs. warm vs. cold</strong>.</p>

<ul>
  <li><strong>Hot</strong> data is fully indexed, searchable in seconds, in active retention. This is your recent events — the last 30 to 90 days, depending on your disk.</li>
  <li><strong>Warm</strong> data is compressed, slower to search, but still accessible. Some stacks support this natively (Elasticsearch ILM, for example).</li>
  <li><strong>Cold</strong> is archived off the box entirely — a tarball on a NAS, a compressed export on an external drive. You need this for incidents where the relevant activity happened months ago.</li>
</ul>

<p>What’s a sane retention window at home? For hot data: 30 days is workable on most single-box setups. 90 days if you have the disk. For security research rather than incident response, even 14 days gives you enough context for most detections.</p>

<p>Rough disk math: Wazuh with a few agents and moderate log volume runs somewhere between 5–20 GB per week depending on how much you’re collecting. Zeek on a busy home network can add another 5–15 GB per week. Plan from there — don’t add sources faster than you add disk.</p>

<div class="callout">
  <p><strong>Field note: don’t starve the box.</strong></p>

  <p>A SIEM that’s disk-full is worse than no SIEM — it silently stops writing events while appearing to work. Set up disk utilization alerts before you start ingesting data. Check your ingest rate after the first week and project forward. The right move is to scope your log sources to what you can actually retain and triage, then expand incrementally. Collecting everything is not a virtue if you can’t store it or act on it.</p>

  <p>Storage sizing is also covered in <a href="/03-prepare-the-vm/">preparing your VM</a> — the numbers there apply here too, and they’ll need scaling upward if this machine doubles as your SOC.</p>
</div>

<hr />

<div class="sidebar-note">
  <p><strong>How I run mine.</strong></p>

  <p>I keep collection intentionally narrow: host logs from the machines I care about, DNS telemetry from my network-level resolver, and firewall events. No Zeek yet — that’s on the list for when I have a dedicated box for it. I use a single-node Wazuh deployment, which means one manager and agents on the hosts worth watching.</p>

  <p>Hot retention is capped at 60 days by index lifecycle policy. Anything older gets archived to a compressed tarball on local storage. When I hit a detection, I triage in the Wazuh dashboard, then drop into a raw log search if it needs deeper investigation. Most alerts close in under five minutes; the ones that don’t get a text file where I write down what I found.</p>

  <p>The most valuable thing I collect is the DNS log. Every device on my network, every query, timestamped and searchable. That’s where the interesting stuff shows up.</p>
</div>

<hr />

<h2 id="quick-reference-the-full-pipeline">Quick Reference: The Full Pipeline</h2>

<table>
  <thead>
    <tr>
      <th>Layer</th>
      <th>Tool options</th>
      <th>What it buys you</th>
    </tr>
  </thead>
  <tbody>
    <tr>
      <td><strong>Log sources</strong></td>
      <td>auditd, journald, Sysmon, pfSense/OPNsense, Pi-hole</td>
      <td>Raw events at the point of activity</td>
    </tr>
    <tr>
      <td><strong>Network visibility</strong></td>
      <td>Zeek, Suricata</td>
      <td>Protocol-level and signature-based network telemetry</td>
    </tr>
    <tr>
      <td><strong>Collection/shipping</strong></td>
      <td>Wazuh agent, Elastic Agent, Filebeat/Winlogbeat, Fluent Bit</td>
      <td>Centralized, reliable event delivery</td>
    </tr>
    <tr>
      <td><strong>Normalization</strong></td>
      <td>ECS, Wazuh decoders, Logstash pipelines</td>
      <td>Consistent schema for detection and search</td>
    </tr>
    <tr>
      <td><strong>Store/index (SIEM)</strong></td>
      <td>Wazuh, Elastic Stack, Security Onion, Graylog</td>
      <td>Searchable, persistent event storage</td>
    </tr>
    <tr>
      <td><strong>Detection</strong></td>
      <td>Wazuh rules, Sigma, Elastic SIEM rules</td>
      <td>Automated identification of threat patterns</td>
    </tr>
    <tr>
      <td><strong>Alerting</strong></td>
      <td>Telegram/email via Wazuh hooks, Elastalert</td>
      <td>Human notification when something matches</td>
    </tr>
    <tr>
      <td><strong>Triage/dashboards</strong></td>
      <td>Wazuh dashboard, Kibana, Grafana</td>
      <td>Workflow for investigating and closing alerts</td>
    </tr>
  </tbody>
</table>

<hr />

<h2 id="next-up">Next Up</h2>

<p>With the architecture clear, the next post gets into the work that actually makes a SOC useful: <a href="/02-threat-hunting/">Threat Hunting in Your Homelab</a> — proactive detection, hypothesis-driven hunting, and how to find things that didn’t fire an alert.</p>

<hr />

<p><em>Previous: <a href="/00-why-a-home-soc/">Why run a SOC at home</a></em></p>]]></content><author><name>MrK</name></author><summary type="html"><![CDATA[The data pipeline behind every SOC — log sources, collection, normalization, a SIEM, detections, and alerting — and how to stand up a real one on a single homelab box.]]></summary></entry><entry><title type="html">Why Run a SOC at Home</title><link href="https://kc-explore.github.io/00-why-a-home-soc/" rel="alternate" type="text/html" title="Why Run a SOC at Home" /><published>2026-05-09T00:00:00+00:00</published><updated>2026-05-09T00:00:00+00:00</updated><id>https://kc-explore.github.io/00-why-a-home-soc</id><content type="html" xml:base="https://kc-explore.github.io/00-why-a-home-soc/"><![CDATA[<p>Security operations is one of those disciplines that looks impossibly large from the outside — war rooms, SIEM consoles, threat analysts staring at dashboards at 3 AM. What a Security Operations Center actually does, stripped of the enterprise theatre, is pretty simple: collect signals, watch for bad things, and respond when you find them. That’s the whole job.</p>

<p>For a homelab of one, the scope collapses considerably. You’re not staffing shifts. You’re not managing a SLA for mean-time-to-detect. You’re building the same mental models and the same muscle memory that blue team practitioners use at work — just on infrastructure you own, with telemetry from services you control, in a lab where breaking things costs you nothing but time. That’s the value. The reps are real even when the stakes are low.</p>

<p>This is the opening post for a new series. The beginner series got you a hardened VM and a working homelab. This series gets you a security practice built on top of it.</p>

<figure class="diagram">
  <img src="/assets/diagrams/blue-team/disciplines-map.svg" alt="Map of the five blue-team disciplines — SOC, threat hunting, threat intelligence, detection engineering, and automation — and how telemetry, detections, alerts, and intel flow between them." />
  <figcaption>The five disciplines of a blue-team practice and how the work flows between them.</figcaption>
</figure>

<hr />

<h2 id="what-soc-actually-means-when-its-just-you">What “SOC” actually means when it’s just you</h2>

<p>In an enterprise, a SOC is a people-process-technology operation: analysts triaging alerts, incident responders jumping on confirmed threats, engineers tuning detections, intelligence teams tracking adversaries, and a SIEM stitching the telemetry together. The technology is expensive. The headcount is substantial.</p>

<p>At home, you have none of that. What you have is:</p>

<ul>
  <li><strong>Technology:</strong> the same open-source tools the industry builds on — Elasticsearch or Loki for log aggregation, Grafana or Kibana for visualization, Zeek or Suricata for network visibility, Sigma rules for detection logic</li>
  <li><strong>Process:</strong> a habit of actually looking at your logs, and a consistent way of recording what you find</li>
  <li><strong>People:</strong> you, wearing all the hats</li>
</ul>

<p>The hat-switching is actually useful. When you’re writing a detection, you’re doing detection engineering. When you’re looking for something that hasn’t triggered an alert yet, you’re threat hunting. When you’re figuring out what a piece of malware does so you know what to look for, you’re doing threat intelligence. Doing all of these yourself — even at small scale — gives you a systems view of how the disciplines depend on each other that’s hard to get any other way.</p>

<hr />

<h2 id="why-bother">Why bother</h2>

<p>The honest answer is that it builds real skills on real telemetry.</p>

<p>When you tune a Sigma rule against your own logs and it produces three false positives, you understand false positives in a way you don’t when it’s someone else’s lab data. When you catch a misconfigured service broadcasting on a port it shouldn’t be, you’ve just done your first detection. When you trace an authentication failure back to a device you forgot was still configured to talk to a service you decommissioned, you’ve done your first incident investigation. These are not toy exercises. The data is live, the infrastructure is real, and the analysis is yours.</p>

<p>You also genuinely will find things. Not nation-state intrusions — that’s not the threat you’re defending against. But commodity nastiness is everywhere. Bots scanning for exposed services, credential stuffing attempts on anything you’ve accidentally left internet-accessible, malware on a device on your network that you didn’t know was there. A security practice that’s functional — even a simple one — catches that class of problem. The reps happen to have real payoffs.</p>

<hr />

<div class="callout">
  <p><strong>Right-size your threat model.</strong></p>

  <p>Home networks face real threats, but not all threats equally. The realistic home threat model is: commodity malware from a phished device, exposed or misconfigured services you forgot about, credential reuse from a breach somewhere else, and noisy IoT devices that shouldn’t be talking to the internet but are.</p>

  <p>What it is not: a determined nation-state adversary, a targeted corporate espionage operation, or the CISA advisory threat-of-the-month. Not because those don’t exist, but because they’re not targeting your homelab. If you build your home security practice around the wrong threat model, you’ll either exhaust yourself chasing phantoms or waste time on controls that don’t match what’s actually in your environment.</p>

  <p>Build for commodity threats. Get good reps. The skills transfer to defending against the sophisticated stuff — but the sophisticated stuff isn’t the thing that’s going to cause you a bad night at home.</p>
</div>

<hr />

<h2 id="the-five-disciplines-this-series-covers">The five disciplines this series covers</h2>

<p>These aren’t five separate fields. They’re a loop. Each one feeds the others, and the loop is what makes a security practice work over time rather than just being a pile of tools.</p>

<p><strong>SOC — collect and watch.</strong> This is the foundation: getting logs from your services and devices into one place, and having dashboards and alerts that surface anomalies. Without this layer, everything else is guessing. We’ll build a lightweight but functional log aggregation setup that gives you actual visibility into what’s happening on your network.</p>

<p><strong>Threat Hunting — proactively look with no alert.</strong> Alerts catch what your detections are tuned to find. Threat hunting is the discipline of going looking for things that haven’t triggered anything yet — following a hypothesis (“do I have any hosts talking to IP ranges I don’t recognize?”) and investigating until you have an answer. It’s the proactive complement to reactive alerting, and it’s where experienced practitioners find the stuff that slips through.</p>

<p><strong>Threat Intelligence — know what to look for.</strong> Intelligence is context: who is attacking what, with which techniques, and leaving which artifacts. At the homelab level, this means consuming free intelligence feeds (abuse.ch, MISP communities, CISA KEV) and using that context to prioritize what you’re watching for. It’s the input that makes detection engineering less of a guessing game.</p>

<p><strong>Detection Engineering — turn knowledge into durable, tested detections.</strong> Once you know what to look for, you write detections — rules that fire when that thing shows up. The “engineering” part matters: detections should be tested against known-good and known-bad data, versioned, and maintained like code. A detection that produces too many false positives gets ignored. One that’s never been tested against a real example of the threat it claims to catch isn’t a detection, it’s a wish.</p>

<p><strong>Automation / SOAR — let machines do the boring response.</strong> Security Orchestration, Automation, and Response sounds fancy. At home it means: when an alert fires, the obvious first response steps happen automatically, and the alert you receive already has the context you need to decide what to do next. Enrichment lookups, automatic isolation of known-bad IPs, ticket creation, Telegram notifications with the relevant log snippet attached — all of this is automatable, and automating it means you spend your time on decisions, not on running the same lookup for the fifth time.</p>

<p>The loop looks like this: telemetry from your SOC layer informs threat hunting; hunting discoveries become intelligence; intelligence shapes detection engineering; detections feed back into the SOC layer; automation handles the response so you’re only interrupted when human judgment is actually required. Run the loop long enough and your practice gets tighter with every iteration.</p>

<hr />

<h2 id="what-you-need-to-follow-along">What you need to follow along</h2>

<p>You need a working, hardened homelab VM. That’s it for prerequisites.</p>

<p>If you don’t have one yet, the beginner series covers it: <a href="/03-prepare-the-vm/">Getting the VM ready</a> and <a href="/04-secure-the-box/">Securing the Box</a> get you to a solid baseline. If you’ve already been through that series, the <a href="/05-starter-projects/">starter projects post</a> is a useful on-ramp — specifically Project 5, monitoring and alerts. Having even a minimal log aggregation setup already running means the first post in this series has something to build on.</p>

<p>The tools we’ll use are open-source and chosen because they’re what practitioners actually use — not because they’re the easiest to install or the most beginner-friendly. There’s a learning curve in places. That’s part of the point.</p>

<hr />

<div class="sidebar-note">
  <p><strong>How I run mine.</strong></p>

  <p>My security practice runs on a dedicated VM — separate from the machines running other services, with its own resource allocation and its own logging configuration. I ingest logs from a handful of sources: network traffic, authentication events, and application logs from the services I care about. That’s enough to be useful without being overwhelming.</p>

  <p>The most valuable habit I’ve developed is treating false positives as bugs to fix rather than noise to ignore. Every time an alert fires on something benign, I tune the detection rather than just dismissing the alert. The result is an alert queue where when something fires, it almost always means something worth looking at. Getting there took a few months of iteration. It’s not glamorous work, but the alternative is an alert system you stop trusting and eventually stop checking.</p>

  <p>The practice doesn’t run itself. I look at it regularly, chase down the occasional anomaly that turns out to be nothing, and occasionally find something interesting. The ratio of interesting-to-nothing is low, which is exactly what you want.</p>
</div>

<hr />

<h2 id="next-up">Next Up</h2>

<p>The first technical post: <a href="/01-soc-architecture/">SOC Architecture for a Homelab of One</a> — what to collect, where to store it, and how to build a logging pipeline that’s actually useful without eating your weekend every time you need to maintain it.</p>

<hr />

<p><em>Previous: <a href="/05-starter-projects/">Starter projects worth your first weekend</a></em></p>]]></content><author><name>MrK</name></author><summary type="html"><![CDATA[What a security operations practice actually is, why you'd build one in a homelab, and the five disciplines this series walks through.]]></summary></entry><entry><title type="html">Starter Projects Worth Your First Weekend</title><link href="https://kc-explore.github.io/05-starter-projects/" rel="alternate" type="text/html" title="Starter Projects Worth Your First Weekend" /><published>2026-05-02T00:00:00+00:00</published><updated>2026-05-02T00:00:00+00:00</updated><id>https://kc-explore.github.io/05-starter-projects</id><content type="html" xml:base="https://kc-explore.github.io/05-starter-projects/"><![CDATA[<p>You have a VM. You locked it down. You have Docker running and a basic reverse proxy you half-understand. This is the point where most tutorials say “congratulations, now go build stuff” and leave you staring at the ceiling.</p>

<p>This post is the stuff.</p>

<p>I’ve picked five projects in rough order of difficulty. None requires a CS degree. All of them teach you something that compounds — each rung makes the next one easier. Do them in order if you want a curriculum, or jump to whichever itch you need to scratch first.</p>

<hr />

<h3 id="project-1--run-a-local-model-with-ollama-and-a-chat-ui">Project 1 — Run a local model with Ollama and a chat UI</h3>

<p><strong>What it is:</strong> Ollama is a tool that downloads and runs open-weight language models locally — Llama, Mistral, Gemma, and a dozen others — and exposes them over a simple API. Pair it with Open WebUI (a browser-based chat interface) and you have a ChatGPT-alike running entirely on your own hardware, sending nothing to anyone.</p>

<p><strong>What you’ll learn:</strong> This is post 01’s theory made tangible. You’ll feel the difference between a 7B and a 13B model when your machine slows to a crawl loading the bigger one. You’ll hit a context window limit mid-conversation and understand why that number matters. You’ll discover that a quantized 4-bit model runs fine on 8 GB of RAM and sounds surprisingly good. None of this sticks from reading — it sticks from watching a progress bar crawl and a model finally answering you.</p>

<p><strong>Rough effort:</strong> An evening. Ollama installs in one command. Open WebUI ships as a Docker image. If your reverse proxy is already working from earlier posts, you’ll have it behind a subdomain in under two hours. The only wildcard is download time — some models are several gigabytes.</p>

<p><strong>Why it’s a good rung:</strong> It closes the loop on everything abstract from the first post. And once the API is running locally, every other project on this list can use it as a backend — you’re building infrastructure, not just a toy.</p>

<p><strong>One thing to watch:</strong> Start with a small model (3B or 7B). It’s tempting to grab the biggest model that fits on your machine, but smaller models answer faster and the quality difference matters less than you expect for simple tasks. Get comfortable with the workflow first.</p>

<hr />

<h3 id="project-2--self-host-a-useful-service-youd-actually-use-daily">Project 2 — Self-host a useful service you’d actually use daily</h3>

<p><strong>What it is:</strong> Pick a service that replaces something you already use — a bookmarking app, a read-later list, a personal homepage that shows you your calendar, the weather, and quick links. Linkding is a clean, minimal bookmark manager. A homepage dashboard (several options exist in the self-hosting community) lets you wire in status widgets for your other services.</p>

<p>The specific tool matters less than the pattern: you’re running a container, pointing your reverse proxy at it, and ending up with a real URL you visit on purpose.</p>

<p><strong>What you’ll learn:</strong> Docker Compose in practice — environment variables, volume mounts, the difference between a container restarting itself and a container that stays dead. Basic reverse proxy routing: how a request for <code class="language-plaintext highlighter-rouge">bookmarks.yourdomain.local</code> becomes a request to <code class="language-plaintext highlighter-rouge">localhost:8765</code> on your server. And crucially, you’ll learn what it feels like to run something that matters to you, which changes how carefully you treat it.</p>

<p><strong>Rough effort:</strong> Easy to medium, depending on the service. Most popular self-hosted tools have a <code class="language-plaintext highlighter-rouge">docker-compose.yml</code> in their README. Budget an evening for setup, and another hour later when you inevitably forget what you did and have to read your own notes (you did take notes, right — more on that below).</p>

<p><strong>Why it’s a good rung:</strong> This one isn’t AI. That’s the point. Homelab is broader than AI, and the Docker + reverse proxy muscle memory you build here is the exact same muscle you use for every AI service later. It’s also a low-stakes environment to break things — if your bookmark manager goes down for a day, the consequences are mild.</p>

<hr />

<h3 id="project-3--a-chat-with-your-docs-setup-rag">Project 3 — A “chat with your docs” setup (RAG)</h3>

<p><strong>What it is:</strong> Retrieval-Augmented Generation, or RAG, is the pattern where you load your own documents — notes, PDFs, articles — into a vector database, and the AI searches that database before answering. Instead of the model hallucinating from its training data, it reads your actual content first.</p>

<p>Tools like Anything LLM or Open WebUI’s built-in document mode let you drop in a folder of PDFs and start asking questions within an hour, no code required. If you want to understand what’s happening under the hood, there are Python-based tutorials that walk you through building the retrieval layer yourself.</p>

<p><strong>What you’ll learn:</strong> Why embeddings exist — your documents become numerical vectors, and “similarity search” means finding vectors near yours. Why context windows matter in practice: you can’t stuff 500 pages into a single prompt, so the retrieval step selects the relevant chunks. What chunking strategy means and why it affects answer quality. This is where the theory of post 01 stops being abstract.</p>

<p><strong>Rough effort:</strong> A weekend, realistically. The tooling is better than it was two years ago, but you’ll spend time on document formatting, chunk size tuning, and being surprised when the model ignores a document that you’re certain contains the answer. Budget time to experiment.</p>

<p><strong>Why it’s a good rung:</strong> RAG is the most common pattern in real enterprise AI systems. Understanding it from first principles — not just clicking “upload PDF” in a SaaS tool — is a durable skill. And the moment you get a good answer from your own notes, it clicks why people care about this.</p>

<hr />

<h3 id="project-4--a-simple-agent-that-does-one-useful-job-on-a-schedule">Project 4 — A simple agent that does one useful job on a schedule</h3>

<p><strong>What it is:</strong> An “agent” in the practical sense: a script that uses a model (local or API-based) plus one or two tools to do a task automatically. The canonical beginner version is a morning briefing — fetch your RSS feeds, summarize the ten most recent items, send yourself a Telegram or email with the digest. Another version: watch a folder for new files and summarize or tag them.</p>

<p>You can build this in Python with a cron job and 50-100 lines of code. If you’re not a Python person, n8n (a self-hosted workflow automation tool) lets you wire this together visually.</p>

<p><strong>What you’ll learn:</strong> Tool use — what it means for an AI to “call a function” rather than just generate text. The mechanics of a cron job and why scheduled automation is surprisingly hard to get right (time zones, error handling, the job that silently fails for three weeks). Prompt engineering for a specific task: how you instruct the model to summarize vs. extract vs. classify, and why the instructions matter a lot.</p>

<p><strong>Rough effort:</strong> Medium to ambitious. The happy path takes an afternoon. Getting it robust — so it handles an RSS feed that goes down, or a model response that’s malformed, or a cron job that fires twice — takes longer. Start simple and add resilience later.</p>

<p><strong>Why it’s a good rung:</strong> This is where “I have a homelab” becomes “my homelab does things for me.” It’s also the point where you start thinking about reliability and failure modes, which is the shift from hobbyist to practitioner. Post 01’s section on agents was abstract. After this project it isn’t.</p>

<hr />

<h3 id="project-5--wire-up-monitoring-and-alerts-for-something-you-run">Project 5 — Wire up monitoring and alerts for something you run</h3>

<p><strong>What it is:</strong> Pick one of your running services and instrument it properly. Uptime Kuma is a self-hosted uptime monitor — you point it at your services’ URLs and it pings them on a schedule, then notifies you (Telegram, email, ntfy, or others) when something goes down. That’s the floor. The ceiling is a proper metrics stack — Prometheus, Grafana, and node-exporter — which gives you CPU, memory, and disk graphs over time.</p>

<p>Start with Uptime Kuma. Add a metrics stack when you’re curious why something is slow.</p>

<p><strong>What you’ll learn:</strong> What “observability” means in practice: the difference between knowing something is down (uptime monitoring) vs. knowing why it’s slow (metrics). How to configure alerting that’s useful without being spammy — alert on what needs human attention, not everything that twitches. And the uncomfortable lesson that services fail in ways you didn’t anticipate, and you only know because you were watching.</p>

<p><strong>Rough effort:</strong> Uptime Kuma is a single Docker container and fifteen minutes of configuration. The full metrics stack is a weekend. Start with the easy version and let curiosity pull you further.</p>

<p><strong>Why it’s a good rung:</strong> This teaches “production thinking” — the mindset shift where you’re not just running services but running services reliably. Every serious homelab eventually gets a monitoring layer, and the people who add it after their second mystery outage wish they’d added it after their first. If you’re building anything others depend on, this isn’t optional.</p>

<hr />

<div class="callout">
  <p><strong>Start here if you only do one.</strong> Project 1 — Ollama plus a chat UI. It’s achievable in an evening, it costs nothing after your hardware, and it makes everything from post 01 click. Once you have a local model running, you can use it as the backend for every other project on this list.</p>
</div>

<hr />

<h2 id="general-advice-before-you-start-building">General advice before you start building</h2>

<p><strong>Start smaller than you think you need to.</strong> The temptation is to plan the full system — monitoring, agents, RAG, the works — and build it all at once. This leads to a half-assembled pile that lives in Docker Compose limbo for weeks. Pick one project. Finish it. Then pick the next.</p>

<p><strong>Snapshot before you tinker.</strong> This was in post 03 and it’s worth repeating here because you’re about to actually need it. Before you upgrade a container, change a config, or “quickly try something,” take a snapshot. The five seconds this costs is the best insurance you have. The restore you do at 11 PM on a Tuesday will be the fastest you’ve ever appreciated a past decision.</p>

<p><strong>Keep a notes file.</strong> Sounds obvious. Almost nobody does it until they’ve forgotten what they did to fix something the first time and spent two hours redoing it. A plain text file in your home directory, a note in Obsidian, a private GitHub repo — the format doesn’t matter. Write down what you installed, what config you changed, and why it didn’t work before the thing that made it work. Future you will be embarrassingly grateful.</p>

<p><strong>Don’t expose anything to the internet without thinking.</strong> Post 04 covered this, but it bears a callback here: the projects above are designed to live on your local network, behind your reverse proxy, accessible only to you. The moment you poke a hole in your firewall or set up an external tunnel, you’ve changed the threat model. That’s sometimes fine and sometimes not — but it’s a decision to make deliberately, not accidentally.</p>

<hr />

<div class="sidebar-note">
  <p><strong>What I actually built first.</strong> My first project was a local chat UI backed by a small language model — nothing fancy, just proof that the thing could answer questions from my own machine without touching a cloud API. The second thing I built was a service I actually use: a bookmark manager that sits behind a local subdomain. I visit it every day, which means I’d notice immediately if it broke. That accountability changed how I thought about reliability. The monitoring came later, after one too many “wait, when did that go down?” moments.</p>
</div>

<hr />

<h2 id="thats-the-arc">That’s the arc</h2>

<p>Six posts ago — <a href="/00-start-here/">post 00</a> — you had a laptop and a vague idea about AI homelabs. Since then you’ve covered how language models actually work, chosen hardware, built a VM, locked it down, and now you have a ladder of real projects to climb.</p>

<p>That’s not nothing. Most people who say they want to run local AI never get past “I should look into that.”</p>

<p>The homelab mindset is: ship something small, break it, fix it, understand it better than before. Repeat. The projects above are designed to be rungs, not destinations. After project 5 you’ll be ready to ask your own questions — “what if I wired the RAG setup into the agent pipeline?” — and you’ll have the vocabulary and the infrastructure to find out.</p>

<p>The best thing about running your own stack is that no one’s rate-limiting you, no one’s reading your prompts, and if something breaks you get to be the one who fixes it. That’s the whole deal. Keep climbing.</p>

<hr />

<p><em>Previous post: <a href="/04-secure-the-box/">Securing the Box</a> — Series start: <a href="/00-start-here/">Start Here</a></em></p>]]></content><author><name>MrK</name></author><summary type="html"><![CDATA[Five AI-homelab projects graded from easy to ambitious — what each one teaches you and why it's a good rung to climb.]]></summary></entry><entry><title type="html">Securing the Box: SSH &amp;amp; the Physical-Access Truth</title><link href="https://kc-explore.github.io/04-secure-the-box/" rel="alternate" type="text/html" title="Securing the Box: SSH &amp;amp; the Physical-Access Truth" /><published>2026-04-25T00:00:00+00:00</published><updated>2026-04-25T00:00:00+00:00</updated><id>https://kc-explore.github.io/04-secure-the-box</id><content type="html" xml:base="https://kc-explore.github.io/04-secure-the-box/"><![CDATA[<p>Security advice for homelabs usually falls into one of two failure modes: way too paranoid for what you’re actually protecting, or dangerously hand-wavy because “it’s just home stuff.” This post tries to hit the honest middle.</p>

<p>We’re going to harden SSH properly — it’s cheap, correct, and you should just do it — and then I’m going to tell you the uncomfortable thing that most tutorials skip: none of that matters if someone can walk up and touch your machine.</p>

<p>Let’s go in order.</p>

<hr />

<h2 id="part-a--ssh-hardening">Part A — SSH Hardening</h2>

<p>Your VM from <a href="/03-prepare-the-vm/">post 03</a> is running. Someone can SSH into it with a username and password. That’s fine for a first boot. It stops being fine the moment anything on that machine is accessible from outside your LAN, and even on your LAN it’s sloppy hygiene. Fix it now, before you build anything on top.</p>

<h3 id="1-key-based-authentication">1. Key-Based Authentication</h3>

<p>Passwords can be guessed, leaked, or phished. SSH keys cannot be guessed — they’re mathematically intractable. This is the single highest-leverage change you’ll make.</p>

<p>On your <strong>local machine</strong> (not the server):</p>

<div class="language-bash highlighter-rouge"><div class="highlight"><pre class="highlight"><code><span class="c"># Generate an ed25519 keypair — modern, fast, short keys</span>
ssh-keygen <span class="nt">-t</span> ed25519 <span class="nt">-C</span> <span class="s2">"your-label-here"</span>
<span class="c"># Accept the default path (~/.ssh/id_ed25519) or name it something meaningful</span>
<span class="c"># Set a passphrase — this protects the key if your local machine is compromised</span>
</code></pre></div></div>

<p>Copy the public key to your server:</p>

<div class="language-bash highlighter-rouge"><div class="highlight"><pre class="highlight"><code>ssh-copy-id your-user@labvm
<span class="c"># Prompts for your password one last time, then installs the key</span>
</code></pre></div></div>

<p>Test it immediately in the <strong>same terminal</strong>:</p>

<div class="language-bash highlighter-rouge"><div class="highlight"><pre class="highlight"><code>ssh your-user@labvm
<span class="c"># Should log in without asking for a password</span>
</code></pre></div></div>

<p>If it works, keep this session open. You’ll need it in the next step.</p>

<h3 id="2-disable-password-auth-and-root-login">2. Disable Password Auth and Root Login</h3>

<p>Open <code class="language-plaintext highlighter-rouge">/etc/ssh/sshd_config</code> on the server:</p>

<div class="language-bash highlighter-rouge"><div class="highlight"><pre class="highlight"><code><span class="nb">sudo </span>nano /etc/ssh/sshd_config
</code></pre></div></div>

<p>Find and set these lines (uncomment them if they’re commented out):</p>

<div class="language-plaintext highlighter-rouge"><div class="highlight"><pre class="highlight"><code>PasswordAuthentication no
PermitRootLogin no
PubkeyAuthentication yes
</code></pre></div></div>

<p><strong>Before you restart sshd, open a second SSH session in a new terminal.</strong> If you misconfigured something and lock yourself out, you want an existing session to fix it.</p>

<div class="language-bash highlighter-rouge"><div class="highlight"><pre class="highlight"><code><span class="c"># In a NEW terminal window/tab, confirm you can still log in with your key:</span>
ssh your-user@labvm
<span class="c"># If this works, you're safe. If it doesn't, don't restart sshd yet — go fix the config.</span>
</code></pre></div></div>

<p>Once confirmed:</p>

<div class="language-bash highlighter-rouge"><div class="highlight"><pre class="highlight"><code><span class="nb">sudo </span>systemctl restart ssh
</code></pre></div></div>

<p>Try a third connection from scratch. No password prompt means it worked.</p>

<h3 id="3-limit-exposure-port-and-allowusers">3. Limit Exposure: Port and AllowUsers</h3>

<p><strong>Change the default port.</strong> This is not real security — anyone running a port scan finds it in seconds. It’s friction. It cuts about 95% of the automated noise from bots that only hammer port 22, which keeps your logs readable. Call it what it is.</p>

<p>In <code class="language-plaintext highlighter-rouge">/etc/ssh/sshd_config</code>:</p>

<div class="language-plaintext highlighter-rouge"><div class="highlight"><pre class="highlight"><code>Port 2222
</code></pre></div></div>

<p>Pick any unprivileged port (1024–65535) that nothing else is using. Update your client’s <code class="language-plaintext highlighter-rouge">~/.ssh/config</code> to match:</p>

<div class="language-plaintext highlighter-rouge"><div class="highlight"><pre class="highlight"><code>Host labvm
    HostName 10.0.0.50
    User your-user
    Port 2222
    IdentityFile ~/.ssh/id_ed25519
</code></pre></div></div>

<p><strong>Restrict who can log in</strong> with <code class="language-plaintext highlighter-rouge">AllowUsers</code>. Even if a user account exists on the server, only listed users can authenticate via SSH:</p>

<div class="language-plaintext highlighter-rouge"><div class="highlight"><pre class="highlight"><code>AllowUsers your-user
</code></pre></div></div>

<p>Restart sshd after any change. Always test from a second session first.</p>

<h3 id="4-firewall-with-ufw">4. Firewall with ufw</h3>

<p>A firewall that defaults to allowing everything is a firewall that isn’t doing anything. Set the policy to deny everything, then punch only the holes you need.</p>

<div class="language-bash highlighter-rouge"><div class="highlight"><pre class="highlight"><code><span class="nb">sudo </span>ufw default deny incoming
<span class="nb">sudo </span>ufw default allow outgoing

<span class="c"># Allow SSH on whatever port you chose</span>
<span class="nb">sudo </span>ufw allow 2222/tcp

<span class="c"># Allow any other services you're actually running and need access to</span>
<span class="c"># sudo ufw allow 8080/tcp   ← example: a web UI you want reachable on LAN</span>

<span class="nb">sudo </span>ufw <span class="nb">enable
sudo </span>ufw status verbose
</code></pre></div></div>

<p>Verify your SSH port is listed as ALLOW before you close your existing session. If you forget to allow SSH and enable ufw, you will lock yourself out. (The fix is to access the machine physically or via the hypervisor console — which is a preview of Part B.)</p>

<h3 id="5-fail2ban">5. fail2ban</h3>

<p>fail2ban watches your logs and temporarily bans IPs that fail authentication too many times. It won’t stop a targeted attack, but it stops the automated credential-stuffing bots that run continuously across the entire internet.</p>

<div class="language-bash highlighter-rouge"><div class="highlight"><pre class="highlight"><code><span class="nb">sudo </span>apt <span class="nb">install </span>fail2ban <span class="nt">-y</span>
<span class="nb">sudo </span>systemctl <span class="nb">enable</span> <span class="nt">--now</span> fail2ban
</code></pre></div></div>

<p>The defaults are reasonable for SSH. If you want to tune the ban threshold:</p>

<div class="language-bash highlighter-rouge"><div class="highlight"><pre class="highlight"><code><span class="nb">sudo </span>nano /etc/fail2ban/jail.local
</code></pre></div></div>

<div class="language-ini highlighter-rouge"><div class="highlight"><pre class="highlight"><code><span class="nn">[sshd]</span><span class="w">
</span><span class="py">enabled</span><span class="w"> </span><span class="p">=</span><span class="w"> </span><span class="s">true</span>
<span class="py">port</span><span class="w">    </span><span class="p">=</span><span class="w"> </span><span class="s">2222</span>
<span class="py">maxretry</span><span class="w"> </span><span class="p">=</span><span class="w"> </span><span class="s">5</span>
<span class="py">bantime</span><span class="w">  </span><span class="p">=</span><span class="w"> </span><span class="s">3600</span>
<span class="py">findtime</span><span class="w"> </span><span class="p">=</span><span class="w"> </span><span class="s">600</span>
</code></pre></div></div>

<p><code class="language-plaintext highlighter-rouge">maxretry = 5</code> means five failures within ten minutes (<code class="language-plaintext highlighter-rouge">findtime</code>) earns a one-hour ban (<code class="language-plaintext highlighter-rouge">bantime</code>). Adjust to taste. Check current bans:</p>

<div class="language-bash highlighter-rouge"><div class="highlight"><pre class="highlight"><code><span class="nb">sudo </span>fail2ban-client status sshd
</code></pre></div></div>

<h3 id="6-keep-it-off-the-public-internet">6. Keep It Off the Public Internet</h3>

<p>This is worth more than all five steps above combined.</p>

<p>Do not port-forward SSH from your home router. Do not expose any homelab service directly to the internet unless you have a very specific reason and know exactly what you’re doing. The moment your SSH port is internet-routable, you are fighting every automated scanner and credential bot on the planet. fail2ban slows them down. A VPN makes them irrelevant.</p>

<p>Use a mesh VPN — <a href="https://tailscale.com/">Tailscale</a> is the easiest entry point, <a href="https://www.wireguard.com/">WireGuard</a> if you want to run your own. The idea: your homelab machine and your laptop are connected through an encrypted overlay network. From the public internet’s perspective, your SSH port doesn’t exist. From your laptop’s perspective, you SSH to a private mesh address as if you were on the same LAN.</p>

<p>Tailscale’s free tier handles most homelabs comfortably. Setup takes about ten minutes:</p>

<div class="language-bash highlighter-rouge"><div class="highlight"><pre class="highlight"><code><span class="c"># On the server</span>
curl <span class="nt">-fsSL</span> https://tailscale.com/install.sh | sh
<span class="nb">sudo </span>tailscale up

<span class="c"># On your local machine — install the Tailscale client for your OS,</span>
<span class="c"># then authenticate both devices to the same account.</span>
<span class="c"># They'll get addresses in the 100.x.x.x range.</span>

<span class="c"># SSH via the mesh address — no router port-forwarding needed</span>
ssh your-user@100.x.x.x
</code></pre></div></div>

<p>Once this is working, there’s no reason to ever expose SSH to the open internet. The attack surface collapses to: people who can authenticate to your Tailscale account. That’s a much smaller problem.</p>

<hr />

<div class="sidebar-note">
  <p><strong>How I lock mine down.</strong></p>

  <p>Keys only — no passwords anywhere. My SSH config file means I never type a hostname or port. My homelab VM is not accessible from the internet at all; I use a mesh VPN so connections look local regardless of where I’m connecting from. Remote access works the same whether I’m on my home network or somewhere else entirely, and the lab machine doesn’t appear in any internet-facing context.</p>

  <p>For anything that leaves the physical premises — a laptop, an external drive with backups — full-disk encryption is non-negotiable. Data at rest is encrypted before it goes anywhere I don’t control. The lab box itself lives somewhere physically controlled; it’s not in a common area where anyone could casually interact with it.</p>

  <p>The firewall defaults to deny. Services are only reachable from the mesh network. Logs are monitored. That’s it — nothing exotic, nothing clever. Boring and consistent beats sophisticated and occasionally skipped.</p>
</div>

<hr />

<h2 id="part-b--the-physical-access-truth">Part B — The Physical-Access Truth</h2>

<p>Now for the part that most SSH hardening guides bury in a footnote or skip entirely.</p>

<p>Everything you just did — key auth, disabled passwords, ufw, fail2ban, mesh VPN — protects you against <strong>network-based</strong> attacks. An attacker trying to reach your machine over the wire hits a wall.</p>

<p><strong>An attacker who can physically touch your machine doesn’t care about any of it.</strong></p>

<hr />

<div class="callout">
  <p><strong>The uncomfortable truth.</strong></p>

  <p>If someone has physical access to your machine, they own it. Not “they might be able to compromise it eventually.” Immediately. They can boot from a USB drive, mount your filesystem, read every file, change passwords, install whatever they want, and leave no trace — in under ten minutes. Your SSH hardening is a locked front door on a house with no walls.</p>

  <p>This isn’t a failure of your configuration. It’s how computers work. Software security assumes the hardware is trusted. The moment that assumption breaks, everything built on top of it breaks too.</p>

  <p>For most homelabbers, the realistic threat model is: a curious roommate, a visiting friend who wanders into your office, a theft. Not a nation-state. Not a targeted corporate adversary. Right-size your response to what you’re actually protecting against.</p>
</div>

<hr />

<h3 id="what-physical-access-actually-lets-someone-do">What Physical Access Actually Lets Someone Do</h3>

<p>Here’s the concrete attack, step by step, so it’s not abstract:</p>

<ol>
  <li>Boot from a USB drive (any live Linux distro)</li>
  <li>Mount your server’s disk — it appears as a regular volume</li>
  <li><code class="language-plaintext highlighter-rouge">chroot</code> into it, run <code class="language-plaintext highlighter-rouge">passwd your-user</code>, pick a new password</li>
  <li>Reboot normally, log in with the new password</li>
  <li>They now have full access with your account</li>
</ol>

<p>Alternatively: pull the drive, put it in a USB enclosure, plug it into their own machine. Read everything. Copy everything. Walk out.</p>

<p>This is not an exotic technique. It requires no special knowledge. It’s in every security curriculum as “basic physical access attack.”</p>

<h3 id="the-actual-mitigations">The Actual Mitigations</h3>

<p><strong>Full-Disk Encryption (LUKS)</strong></p>

<p>This is the real answer. If the disk is encrypted, pulling the drive or booting from USB gets an attacker a pile of ciphertext. Without the passphrase or key, it’s useless.</p>

<p>On Ubuntu/Debian, LUKS encryption is offered during OS installation. Enable it. The cost is: you have to enter a passphrase each time the machine boots (or configure a key file, which has its own tradeoffs). For a homelab VM that doesn’t reboot often, this is a minor inconvenience with meaningful protection.</p>

<p>If you didn’t encrypt at install time, there’s no painless retrofit — you’d need to reinstall. Worth knowing for your next build.</p>

<div class="language-bash highlighter-rouge"><div class="highlight"><pre class="highlight"><code><span class="c"># Check if your current install is LUKS-encrypted:</span>
lsblk <span class="nt">-o</span> NAME,FSTYPE,MOUNTPOINT | <span class="nb">grep </span>crypto
<span class="c"># or</span>
<span class="nb">sudo </span>dmsetup <span class="nb">ls</span> <span class="nt">--target</span> crypt
</code></pre></div></div>

<p>If you see <code class="language-plaintext highlighter-rouge">crypto_LUKS</code> in the output, you’re already encrypted. If not, file it away as “do this on the next machine.”</p>

<p><strong>BIOS/UEFI Password and Boot Order</strong></p>

<p>Set a BIOS/UEFI password and configure the machine to boot only from its primary disk. This slows down the USB-boot attack — an attacker has to clear CMOS or disassemble the machine to get past it. Not impossible, but it adds friction and time.</p>

<p>On most motherboards this is in the UEFI settings under “Security” or “Boot.” The exact menu varies by vendor. Look for “Supervisor Password” and “Boot Priority.”</p>

<p>This is a speed bump, not a wall. Someone with enough time and physical access can bypass it. Combined with LUKS, though, you’re raising the effort level considerably.</p>

<p><strong>Where the Box Physically Lives</strong></p>

<p>For a home setup, this is underrated. A server in a locked room is more secure than an internet-hardened machine sitting on an open desk in a common area. Locks and doors are physical security controls, and they work.</p>

<p>You don’t need a cage or a data center. A spare room with a lock, a closet, an office you control — all of these reduce your exposure to the realistic threat model (roommate curiosity, visitors, opportunistic theft) significantly. A door lock costs zero dollars and takes no configuration.</p>

<p><strong>The Honest Takeaway</strong></p>

<p>Harden SSH because it’s cheap, correct, and good hygiene. You should do it regardless. But be honest with yourself about what it protects: your network perimeter, not your hardware.</p>

<p>If you’re running a homelab with data you actually care about — credentials, personal files, anything sensitive — full-disk encryption on anything that could leave your physical control is the right call. The box in your home office is probably fine sitting behind a locked door. The laptop you carry around, the external drive with backups, the NUC you’d take to a friend’s place: encrypt those.</p>

<p>And if someone ever breaks in and takes the hardware, the disk encryption means they got hardware, not data. That’s a bad day, but it’s a recoverable one.</p>

<hr />

<h2 id="quick-reference-what-each-layer-buys-you">Quick Reference: What Each Layer Buys You</h2>

<table>
  <thead>
    <tr>
      <th>Control</th>
      <th>Protects Against</th>
      <th>Doesn’t Protect Against</th>
    </tr>
  </thead>
  <tbody>
    <tr>
      <td>Key-based SSH auth</td>
      <td>Password guessing, credential stuffing</td>
      <td>Physical access</td>
    </tr>
    <tr>
      <td>Disabled root login</td>
      <td>Brute-force on root account</td>
      <td>Physical access</td>
    </tr>
    <tr>
      <td>ufw deny incoming</td>
      <td>Port scanning, unsolicited connections</td>
      <td>Physical access</td>
    </tr>
    <tr>
      <td>fail2ban</td>
      <td>Automated brute-force bots</td>
      <td>Physical access</td>
    </tr>
    <tr>
      <td>Mesh VPN (no port forwarding)</td>
      <td>Internet-based attacks entirely</td>
      <td>Physical access</td>
    </tr>
    <tr>
      <td>LUKS full-disk encryption</td>
      <td>Drive theft, USB boot attacks</td>
      <td>Someone who has your passphrase</td>
    </tr>
    <tr>
      <td>BIOS password + boot order</td>
      <td>Quick USB boot attacks</td>
      <td>Determined attacker with time</td>
    </tr>
    <tr>
      <td>Physical location control</td>
      <td>Opportunistic access</td>
      <td>Targeted break-in</td>
    </tr>
  </tbody>
</table>

<p>The pattern is obvious. The software controls are all good and worth doing. Physical is where the game actually ends.</p>

<hr />

<h2 id="next-up">Next Up</h2>

<p>Post 05 gets back to building things: <a href="/05-starter-projects/">Starter projects worth your first weekend</a> — a short list of homelab projects that are genuinely useful day one, not just impressive on paper. Now that the box is hardened, we can actually put it to work.</p>

<hr />

<p><em>Previous: <a href="/03-prepare-the-vm/">Getting the VM ready</a></em></p>]]></content><author><name>MrK</name></author><summary type="html"><![CDATA[Harden SSH the right way — then understand why physical access is the security boundary that actually matters for a homelab.]]></summary></entry><entry><title type="html">Getting the VM Ready</title><link href="https://kc-explore.github.io/03-prepare-the-vm/" rel="alternate" type="text/html" title="Getting the VM Ready" /><published>2026-04-18T00:00:00+00:00</published><updated>2026-04-18T00:00:00+00:00</updated><id>https://kc-explore.github.io/03-prepare-the-vm</id><content type="html" xml:base="https://kc-explore.github.io/03-prepare-the-vm/"><![CDATA[<p>If you followed <a href="/02-choosing-your-stack/">post 02</a>, you picked a rough direction for your stack. Now you need somewhere to put it. That’s what this post is about: giving your homelab a home that isn’t your laptop’s desktop folder.</p>

<p>The short version: you want a virtual machine. Everything else flows from that decision.</p>

<hr />

<h2 id="why-a-vm-and-not-bare-metal">Why a VM and not bare metal</h2>

<p>The honest answer is reversibility. When you install things directly onto your laptop or a spare PC and something breaks, untangling it is tedious. When you do it inside a VM, you delete the VM and start over. That’s the whole pitch.</p>

<p>More concretely:</p>

<ul>
  <li><strong>Snapshots.</strong> You can freeze the state of a VM before doing something risky and roll back to that exact point if it goes sideways. This is not a feature most operating systems expose natively. It’s a superpower.</li>
  <li><strong>Isolation.</strong> Your AI services don’t share libraries or ports with your daily-driver environment. You can install conflicting versions of Python, Node, whatever, without caring.</li>
  <li><strong>Reproducibility.</strong> If you ever want to rebuild the lab from scratch on better hardware, the process is just “spin up a new VM, follow the same steps.” You’re not reverse-engineering a years-old hand-rolled setup.</li>
</ul>

<p>The mental model I find useful: your homelab should be <em>disposable and reproducible</em>. The VM is disposable. The knowledge and configs you build up are what you keep.</p>

<hr />

<h2 id="where-to-actually-run-the-vm">Where to actually run the VM</h2>

<p>You have three realistic options. None is universally correct.</p>

<h3 id="option-a-your-existing-laptop-or-desktop-with-virtualbox-or-similar">Option A: Your existing laptop or desktop, with VirtualBox (or similar)</h3>

<p>VirtualBox is free, runs on Windows, macOS, and Linux, and is the lowest-friction way to start. Download a Linux ISO, create a VM, you’re done in 20 minutes.</p>

<p>The catch: your laptop sleeps. Your homelab sleeps with it. If you just want to learn and experiment and don’t care about services being up overnight, this is fine. If you want a Telegram bot or a scheduled scraper running at 2 AM, this will frustrate you quickly.</p>

<p>Use this option if you’re not sure yet whether you want a homelab, or if you genuinely don’t have other hardware.</p>

<h3 id="option-b-a-spare-pc-or-mini-pc-running-proxmox-recommended">Option B: A spare PC or mini-PC running Proxmox (recommended)</h3>

<p>This is the sweet spot. A mini-PC — the kind of small box that costs $150-300 used — draws 10-15W at idle, sits on a shelf, and runs 24/7 without complaint. You install Proxmox VE on it (type-1 hypervisor, runs directly on the hardware), then spin up one or more Linux VMs on top.</p>

<p>Why Proxmox specifically: it’s free, mature, well-documented, and has a solid web UI for managing VMs without touching a command line. Snapshots, backups, and VM cloning are first-class features. It’s also what most homelab guides assume, so you’ll find help easily.</p>

<p>If you’re in this for the long run and you have any spare hardware, this is where to land.</p>

<h3 id="option-c-a-cloud-vps">Option C: A cloud VPS</h3>

<p>If you have no spare hardware and don’t want to buy any, a cheap VPS (a small virtual private server on a provider like Hetzner, DigitalOcean, or Vultr) gets you a 24/7 Linux box for $5-10/month. You can run everything in this series on it.</p>

<p>The trade-offs: it’s not “at home,” so it’s less private. You’re paying a recurring cost. And you can’t do GPU passthrough later if you want to run local LLMs. It’s a valid fallback, not the ideal destination.</p>

<hr />

<div class="sidebar-note">

  <p><strong>How my lab is laid out.</strong> I have a small always-on box running a type-1 hypervisor. On top of that I have a handful of VMs carved up by purpose: one general-purpose VM for services and automation, one dedicated to security tooling, and a couple of lightweight containers for things like DNS and media. Before any significant change — upgrading a database, trying a new configuration — I take a snapshot. It takes about five seconds and has saved me at least a dozen times. Nothing in the lab shares state with my daily-driver machine.</p>

</div>

<hr />

<h2 id="provisioning-a-base-linux-vm">Provisioning a base Linux VM</h2>

<p>For the rest of this series I’ll assume Ubuntu Server LTS or Debian. Either works. Both are stable, well-supported, and have packages for everything you’ll need.</p>

<p><strong>Step 1: Get the ISO.</strong> Download the latest Ubuntu Server LTS from ubuntu.com, or Debian from debian.org. The server edition has no desktop environment — that’s what you want. Less overhead, fewer attack surface.</p>

<p><strong>Step 2: Create the VM.</strong> In Proxmox, click “Create VM” and walk through the wizard. In VirtualBox, click “New.” The wizard will ask you for:</p>

<ul>
  <li>Name: something you’ll recognize. <code class="language-plaintext highlighter-rouge">labvm</code> or <code class="language-plaintext highlighter-rouge">homelab</code> is fine.</li>
  <li>Type/OS: Linux, Ubuntu or Debian as appropriate.</li>
  <li>Disk, RAM, CPU: see the callout below.</li>
  <li>Network: NAT works for VirtualBox. In Proxmox, use a bridged adapter so the VM gets its own IP on your LAN — this matters when you want to reach services from your phone or other devices.</li>
</ul>

<p><strong>Step 3: Install the OS.</strong> Attach the ISO, boot the VM, follow the installer. When it asks about additional packages during setup, skip them — you’ll install what you need. The one thing to select during install: OpenSSH server. You want SSH access from day one.</p>

<hr />

<div class="callout">

  <p><strong>Sensible starting specs.</strong> For a general-purpose services VM running the kinds of things in this series (automation tools, small web apps, scheduled scripts):</p>

  <ul>
    <li><strong>vCPU:</strong> 2-4 cores</li>
    <li><strong>RAM:</strong> 4-8 GB</li>
    <li><strong>Disk:</strong> 40-60 GB</li>
  </ul>

  <p>This is conservative and deliberately so. You can always expand later. What you can’t do is shrink a disk easily, so don’t overprovision on day one.</p>

  <p>One caveat: local LLMs are a completely different beast. Running a model like Llama or Mistral locally needs 8-16 GB of RAM at minimum just for the model weights, and benefits enormously from a dedicated GPU. If that’s your goal, plan for a separate VM (or a separate machine) with much larger specs — and possibly GPU passthrough if your hypervisor and hardware support it. Don’t try to cram a local LLM into the same VM as your other services.</p>

</div>

<hr />

<h2 id="first-boot-setup">First-boot setup</h2>

<p>Fresh install, logged in, cursor blinking. Here’s the checklist I run on every new VM before I do anything else:</p>

<div class="language-bash highlighter-rouge"><div class="highlight"><pre class="highlight"><code><span class="c"># 1. Update everything</span>
<span class="nb">sudo </span>apt update <span class="o">&amp;&amp;</span> <span class="nb">sudo </span>apt upgrade <span class="nt">-y</span>

<span class="c"># 2. Set your hostname (pick something meaningful to you)</span>
<span class="nb">sudo </span>hostnamectl set-hostname labvm

<span class="c"># 3. Set your timezone</span>
<span class="nb">sudo </span>timedatectl set-timezone America/Toronto
<span class="c"># Check available zones: timedatectl list-timezones | grep America</span>

<span class="c"># 4. Create a non-root sudo user (if the installer didn't already)</span>
<span class="nb">sudo </span>adduser yourname
<span class="nb">sudo </span>usermod <span class="nt">-aG</span> <span class="nb">sudo </span>yourname

<span class="c"># 5. Install essentials</span>
<span class="nb">sudo </span>apt <span class="nb">install</span> <span class="nt">-y</span> curl git unzip htop

<span class="c"># 6. Confirm SSH is running (it should be from the install step)</span>
<span class="nb">sudo </span>systemctl status ssh
</code></pre></div></div>

<p>That’s it. A few minutes of work. The VM is now in a clean, known state with a real user account and the basics installed.</p>

<p>One thing worth emphasizing: <strong>don’t do your regular work as root.</strong> The installer creates a root account; you should use a non-root user with <code class="language-plaintext highlighter-rouge">sudo</code> for everything day-to-day. It’s a habit that prevents a surprising number of accidents.</p>

<hr />

<h2 id="take-a-snapshot-right-now">Take a snapshot right now</h2>

<p>Before you install a single service or run another command, take a snapshot.</p>

<p>In Proxmox: select the VM, go to Snapshots, click “Take Snapshot.” Give it a name like <code class="language-plaintext highlighter-rouge">clean-install</code>. Done.</p>

<p>In VirtualBox: with the VM powered off, go to Machine &gt; Tools &gt; Snapshots, click “Take.” Same idea.</p>

<p>Why now, before anything is installed? Because this is the cleanest state the VM will ever be in. If anything goes wrong in the next post, the next month, or the next year, you can roll back to this snapshot and get a fresh start in seconds without downloading ISOs or running through the installer again.</p>

<p>I take a snapshot before any significant change: before upgrading a major package, before trying a new configuration, before installing something unfamiliar. It costs almost nothing and has saved me from painful rollbacks more times than I can count. Make it a reflex.</p>

<hr />

<h2 id="whats-next">What’s next</h2>

<p>You have a running VM, a non-root user, and a clean-install snapshot. The VM is reachable over your local network — but right now, anyone on that network (or anyone who can reach it) could potentially poke at it.</p>

<p>Before you install anything useful, you want to lock the front door. The next post covers securing this VM: setting up SSH key authentication, disabling password login, and understanding why SSH is how you’ll actually drive this machine day-to-day (not the hypervisor console).</p>

<p><strong>Next up:</strong> <a href="/04-secure-the-box/">Securing the box: SSH &amp; the physical-access truth</a></p>

<hr />

<p><em>Previous: <a href="/02-choosing-your-stack/">Choosing your stack</a></em></p>]]></content><author><name>MrK</name></author><summary type="html"><![CDATA[Where your homelab actually lives: choosing a hypervisor, provisioning a base Linux VM, sizing it, snapshots, and first-boot setup.]]></summary></entry></feed>